| Issue |
A&A
Volume 695, March 2025
|
|
|---|---|---|
| Article Number | A206 | |
| Number of page(s) | 12 | |
| Section | Extragalactic astronomy | |
| DOI | https://doi.org/10.1051/0004-6361/202451700 | |
| Published online | 19 March 2025 | |
Baryonic Ecosystem IN Galaxies (BEINGMgII)
I. Host galaxies of ultra-strong Mg II absorbers in the Subaru Hyper Suprime-Cam Survey
1
Indian Institute of Astrophysics (IIA), Koramangala, Bangalore 560034, India
2
Pondicherry University, R.V. Nagar, Kalapet, Puducherry 605014, India
3
Università degli Studi di Milano-Bicocca, Dip. di Fisica G. Occhialini, Piazza della Scienza 3, 20126 Milano, Italy
4
INAF – Osservatorio Astronomico di Trieste, Via G. B. Tiepolo 11, I-34143 Trieste, Italy
5
INAF – Osservatorio Astronomico di Brera, Via Brera 28, 21021 Milano, Italy
6
European Southern Observatory, Karl-Schwarzschildstrasse 2, D-85748 Garching bei Munchen, Germany
7
Aix Marseille Université, CNRS, LAM (Laboratoire d’Astrophysique de Marseille) UMR 7326, F-13388 Marseille, France
8
Key Laboratory for Research in Galaxies and Cosmology, Shanghai Astronomical Observatory, Chinese Academy of Sciences, 80 Nandan Road, Shanghai 200030, PR China
9
Kavli Institute for the Physics and Mathematics of the Universe (WPI), The University of Tokyo Institutes for Advanced Study (UTIAS), The University of Tokyo, 5-1-5 Kashiwanoha, Kashiwa-shi, Chiba 277-8583, Japan
10
Kavli Institute for Astronomy and Astrophysics, Peking University, Beijing 100871, PR China
11
Department of Astronomy, School of Physics, Peking University, Beijing 100871, PR China
⋆ Corresponding author; This email address is being protected from spambots. You need JavaScript enabled to view it.
Received:
29
July
2024
Accepted:
10
December
2024
Abstract
Context. We study the galaxies hosting ultra-strong Mg II (USMgII) absorbers at small impact parameters of ∼2″ (5−20 kpc) spanning a redshift range of 0.4 ≤ z ≤ 1.7 using deep high-resolution images from the Hyper Suprime-Cam Subaru Strategic Survey and spectra from the Sloan Digital Sky Survey (SDSS).
Aims. Our aim is to explore the physical origin of the USMgII absorbers and characterize the associated galaxies.
Methods. We performed a galaxy spectral energy distribution (SED) fitting using optical and near-IR multiband data to identify potential absorber host galaxies. Further, we searched for the [O II] nebular emission line from absorber galaxies in the SDSS fiber spectra.
Results. From a total of 418 USMgII absorbers with W2796 ≥ 3 Å along 412 quasar sight lines, we detected 50 galaxies based on [O II] λλ3727, 3729 nebular emission detected at the ≥2σ level. Utilizing the [O II] emission from the stacked spectrum and employing the best-fit galaxy SED template, we further identified 86 galaxies, leading to a total of 136 bona fide USMgII galaxies. With a prerequisite of having a minimum of four HSC passbands available, we found a detection rate of ∼38% at an average impact parameter of 11.4 kpc. We find that galaxies hosting USMgII systems are typically star-forming main sequence galaxies, with 21% exhibiting a starburst nature. The non-zero [O II] emission along the “clear” sight lines, with no stellar counterpart, indicates that the USMgII absorbers may likely emanate from the unseen faint galaxies near the quasar. The USMgII absorbers preferentially align along the major and minor axes of the galaxy, which suggests that they originate in the disk or large-scale wind. We show that the distribution of W2796 as a function of the impact parameter indicates a discernible radial dependence for the “disk” and “wind” subsets, with the observed large scatter in W2796 potentially attributed to large-scale outflows. The quasar sight line hosting USMgII systems show a factor of three higher galaxy surface density at impact parameters of ≲50 kpc, highlighting the multiple pathways that give rise to USMgII absorption.
Key words: galaxies: evolution / galaxies: halos / galaxies: high-redshift / galaxies: ISM / quasars: absorption lines / galaxies: star formation
© The Authors 2025
 Open Access article, published by EDP Sciences, under the terms of the Creative Commons Attribution License (https://creativecommons.org/licenses/by/4.0), which permits unrestricted use, distribution, and reproduction in any medium, provided the original work is properly cited.
This article is published in open access under the Subscribe to Open model. This email address is being protected from spambots. You need JavaScript enabled to view it. to support open access publication.
1. Introduction
Gas accretion and galactic winds are firmly established as essential drivers for the growth of galaxies. Simulations suggest that galactic winds regulate star formation by expelling gas and heating the interstellar and circumgalactic medium (CGM), thereby influencing the rate and efficiency of star formation within galaxies (Carr et al. 2023). Besides shaping the galaxy luminosity function, they also significantly influence the stellar mass-metallicity relation (Tremonti et al. 2004) and inject a large amount of dust and metals into the galactic halo and intergalactic medium (IGM; Oppenheimer & Davé 2006; Péroux et al. 2020).
The widespread presence of outflows is evidenced by a commonly observed blue-shifted resonance-line absorption in the spectra of normal star-forming galaxies with high specific star formation rates (sSFRs; Rupke et al. 2019; Kehoe et al. 2024). In starburst galaxies, such winds are seen as strong Mg II absorption with velocities ≳1000 km s−1 and are attributed to the superwinds (Heckman et al. 2000). Such velocities are comparable to or exceed the escape velocity from L⋆ galaxies. However, wind properties such as mass outflow rate and mass loading factor are poorly constrained due to the large uncertainty associated with the distance of absorbing gas, metallicity, and the ionization parameter (Veilleux et al. 2005).
Quasar absorption-line studies tracing low-ion absorption in the spectrum of a bright background source provide information about the gas flows in and around galaxies in a luminosity unbiased manner (Steidel et al. 2010). The majority of quasar-galaxy pair research has focused on the resonant Mg IIλλ2796, 2803 doublet lines, which are produced from a photoionized gas at a temperature of 104 K and are extensively accessible over 0.3 ≤ z ≤ 2.3 from the ground (Tumlinson et al. 2017). This transition is extremely sensitive to the presence of the interstellar medium and the CGM (Tumlinson et al. 2017; Feltre et al. 2018). Such investigations, particularly of strong Mg II absorbers with W2796 > 0.7 Å have revealed that the galaxy halo of most sub-L⋆ galaxies contains metal-enriched gas that extends to projected distances of > 100 kpc (Chen et al. 2010; Nielsen et al. 2013). The Mg II gas has been found to have patchy gaseous cross sections with a high covering fraction of ∼70% out to ∼50 kpc for W2796 > 0.3 Å (Dutta et al. 2020). The absorption strength strongly depends on the stellar mass and the distance from the galaxy. A bi-modality has been observed in the distribution of neutral hydrogen and metal-enriched gas as well as its metallicity as a function of the azimuthal angle; intriguingly, this bi-modality has also been seen in emission (Guo et al. 2023, but see Dutta et al. 2023 for isotropic signal), which supports their wind origin (Kacprzak et al. 2014; Lan & Mo 2018; Zabl et al. 2021; Weng et al. 2023).
A rare class of Mg II absorbers are ultra-strong Mg II systems defined as W2796 > 3 Å, and they comprise only 3% of the MgII absorber population. Unlike the kinematic spread of ∼100 km s−1 seen in Galactic Mg II absorbers in quasar spectra, the USMgII absorbers exhibit strong absorption over a velocity spread of several hundred km s−1, which is likely to originate from the galactic superwind (Bond et al. 2001) or gas dynamics of the intra-group medium (Gauthier 2013). Direct evidence of large-scale outflows in USMgII systems has been seen in high-redshift starburst galaxies (Nestor et al. 2011; Rubin et al. 2010). Ménard et al. (2011) found that the strong Mg II trace a substantial fraction of the global [O II] luminosity density and most likely trace the galaxies with vigorous star formation (see also Joshi et al. 2017a, 2018). The association of strong Mg II absorbers with the bluer galaxies close to quasar line of sight is also revealed in co-added images from the Sloan Digital Sky Survey (SDSS) (Zibetti et al. 2007). However, the true nature of USMgII absorber host galaxies and their origin remains unclear.
In recent efforts to study the absorber galaxy connection using advanced integral field spectrographs mapping the galaxies over large impact parameters (∼200 kpc), the majority of the Mg II absorbers have commonly been observed to be associated with multiple galaxies. The large scatter observed in absorbing galaxy properties might indicate that the observed absorption essentially may not only map the outflows but may also originate from the multiple halos of a galaxy group (Bielby et al. 2017; Péroux et al. 2017; Fossati et al. 2019; Dutta et al. 2020); the intra-group medium (Gauthier 2013); and/or cool stripped gas from environmental processes Dutta et al. (2020). The notion that the absorption is caused by galaxies at the close impact parameter, however, remains viable because it is highly challenging to find such faint galaxies in the glare of a bright background quasar. Most recently, Guha et al. (2024) detected 28 USMgII absorber host galaxies at an average impact parameter of 19 kpc over 0.6 ≤ z ≤ 0.8. They show that ∼29% of USMgII absorbers with a wide velocity spread of more than 300 km s−1 originate from gas flows (infall or outflow) in isolated massive galaxies, while ≥21% of these systems emanate from the galaxy interaction. Moreover, they found that USMgII host galaxies exhibit slightly lower ongoing star formation rate (SFR) compared to main sequence galaxies with the same stellar mass, suggesting a transition from star-forming to quiescent states (see Guha et al. 2022). Therefore, it is imperative to investigate the possible origin of USMgII systems, their connection to galaxies, and their overall contribution to the global SFR density.
This paper is organized as follows. Section 2 describes our sample and the analysis. In Sect. 3, we examine the absorber galaxy association and the nature of galaxies associated with UGMgII absorbers. The discussion and conclusions of this study are summarized in Sect. 4. Throughout this work, we assume a flat Universe with H0 = 70 km s−1 Mpc−1, Ωm = 0.3, and ΩΛ = 0.7.
2. Sample selection
To probe the baryonic ecosystem in galaxies producing strong Mg II absorption (BEINGMgII), we exploited the largest Mg II absorber catalog from Anand et al. (2022) consisting of 107 263 quasar sight lines hosting a total of 159 524 Mg II absorbers. We considered the absorbers within 500 km s−1 as a single system, which resulted in 130 596 absorbers. Of these, 4381 are USMgII absorbers. To search for the possible faint absorber host galaxies, we utilized deep multiband (g, r, i, z, y) imaging data from the Hyper Supreme-Cam Subaru Strategic Program (HSC-SSP) Survey (Aihara et al. 2022). The HSC-SSP Survey offers high-resolution imaging data (median seeing of ∼0.6″, depth of r ∼ 26 mag at 5σ) over a wide sky region of about 1400 sq. deg. Among these 4381 USMgII absorbers, we found 630 distinct quasar sight lines (hosting 636 absorbers) covered in HSC-SSP footprints.
Taking advantage of the multi-epoch spectrum from SDSS, we generated the higher signal-to-noise ratio co-added spectrum and remeasured the W2796. The absorbers with the Mg IIλλ2796, 2803 doublet ratio outside the optically thin (W2796/W2803 ≈ 2) and optically thick (W2796/W2803 ≈ 1) limits were then flagged for visual inspection, which resulted in 583 absorbers with W2796 > 3 Å. The marginal difference in the number of USMgII systems is primarily due to the removal of poor S/N systems. Finally, to ensure the coverage of key spectral features (e.g., D4000) and in order to identify the absorber host galaxy within the Hyper Supreme-Cam (HSC) passbands, we only selected the absorbers with redshift ≤1.7; this led to a final sample of 418 USMgII systems along 412 sight lines.
3. Analysis
3.1. Searching for the potential host in HSC images
At the survey depth of r ∼ 26 mag, the quasar host galaxies are found to be prominent even at z ∼ 1 (Ishino et al. 2020). Therefore, we modeled the quasar with a point spread function (PSF) along with a Sérsic profile representing the quasar host galaxy. Here, we utilized differential evolution global optimization (Storn & Price 1997) to achieve the best-fit model. Furthermore, we implemented a regularization strategy to optimize the residuals. Most of the sample exhibits a well-modeled quasar profile, as depicted in Fig. 1, except for a few of the quasars with a saturated PSF or bad image quality.
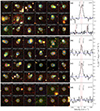 |
Fig. 1. Host galaxies associated with the ultra-strong Mg II absorbers. The postage stamp HSC color composite images centered on the quasar are depicted with gray contours. The SDSS fiber, with a radius of 1.5″, is indicated by dashed circles, while the cyan-colored aperture highlights the USMgII host galaxy. The first three rows exhibit an example set of potential host detections at close quasar proximity for USMgII systems with direct [O II] detection (at the 2σ level) followed by [O II] detections at the < 2σ level in rows 4−7. The bottom two rows display cases with no detection around the quasar. Additionally, the right panels showcase the stacked [O II] emission line profiles, and the gray curve shows the associated error. |
Following the quasar PSF removal for all the filters, we obtained a deeper co-added image by median stacking all the bands using SWarp1 (Bertin et al. 2002). Subsequently, we extracted the sources from the co-added image frame using Source Extractor (Bertin & Arnouts 1996), demanding at least five contiguous pixels to be detected at 3σ levels. At first, we considered the apertures with consistent detection across at least three bands to avoid false-positive detection due to poor quasar removal. We further performed a visual check of all the sight lines, in particular, to scrutinize the sources with limited (one or two) bands and images affected by saturation or improper PSF modeling.
Finally, for the absorber galaxy association, we restricted our search to objects for which twice the effective radius of the galaxy (comprising ∼75% of the galaxy luminosity) lies inside the SDSS fiber radius of 1.5 arcsec (see Sect. 3.2). This offers the advantage of identifying the absorber host galaxy based on strong nebular emission imprinted on the SDSS fiber spectra of the quasar. For a redshift range of 0.5 < z < 2, the above search radius of 1.5 arcsec corresponds to a physical size of ∼9−13 kpc. Over these redshift ranges, considering an average size evolution of ∼7 − 4 kpc for a typical star-forming galaxy with M⋆ ∼ 1010 M⊙ (van der Wel et al. 2014) sets an upper limit on the impact parameters at ∼17 kpc. We note that based on the anticorrelation between W2796 and ρ, a USMgII absorber host galaxy is expected to be observed at impact parameters of ≲5 kpc (Nielsen et al. 2013). In addition, the average impact parameter of USMgII systems in a handful of studies has been found to be ∼20 kpc (see Sect. 1), which indicates that our adopted search radius is adequate to trace the USMgII galaxies close to the quasar.
Among the 412 sight lines, we detected a likely potential host galaxy in the deep HSC co-added images at the 3σ level along 168 sight lines within the defined search radius. In the section that follows, we investigate their connection with the W2796 ≥ 3 Å systems. Additionally, we classified 175 sight lines hosting 178 absorbers with at least four HSC passbands and no stellar counterpart as “clear” sight lines. The remaining 69 sight lines without a stellar counterpart detected within the search radius and having an insufficient number of HSC passbands to be categorized as “clear” sight lines were excluded from further analysis. The summary of the detected galaxies, number of filters with source detection, spectral energy distribution (SED) fitting results, and the respective categories are listed in Table 1.
Source detection summary for Mg II absorbers based on photometry.
3.2. [OII] nebular emission line within SDSS fiber
The SDSS fiber-fed spectroscopic observations utilize a finite fiber of diameter of 3″ (SDSS-DR7; Abazajian et al. 2009) and 2″ (SDSS-DR12: BOSS; Alam et al. 2015) that register photons from all the objects that fall within the fiber along the line of sight (Noterdaeme et al. 2010; Joshi et al. 2017a). To detect the [O II] λλ3727, 3729 nebular emission, when available, we utilized the multi-epoch SDSS or BOSS spectrum and generated the co-added higher S/N spectrum for the SDSS or BOSS spectrograph separately. For each USMgII absorber, we searched for the [O II] nebular emission lines at the expected location for zabs in the continuum-subtracted spectrum. To get the best quasar continuum, we used the iterative B-spline fitting along with the median smoothing function. Next, using FELIS2 (Schmidt 2021), we cross-correlated a [O II] nebular emission line template generated from the SDSS galaxy template at the absorption redshift of a USMgII absorber within ±500 km s−1. FELIS uses the model template (normalized to an integrated flux of unity) and applies a flux scaling to the template to obtain the best match by providing the S/N for the minimized χ2. Finally, we also performed a visual inspection to avoid any false positives due to poor sky subtraction.
For 168 (170 absorbers) out of 412 sight lines where we detected a potential host galaxy in the deep HSC images, the [O II] nebular emission line is covered within the SDSS spectral coverage of 3600−10 400 Å. We further note that 89% of quasar sight lines have BOSS spectra obtained with a fiber radius of 1 arcsec; however, for a majority (77%) of these systems, at least 2 Re of the galaxies fall inside the fiber, increasing the likelihood of [O II] detection (see above). We considered a [O II] detection threshold of 2σ, resulting in a total detection of 50 USMgII absorber host galaxies (see Table 1). Among these systems, [O II] nebular emission is detected at ≥3σ level for 27 USMgII systems. In Fig. 1 (top three rows), we show examples where the galaxy is visible within the fiber radius of 1.5″. A strong [O II] emission is detected at the ∼13.7σ level in the stacked spectrum. For this subset, the other nebular emission, such as Hβ and [O III], falls in the sky region, but we see these features in the co-added spectrum (see Fig. 1, last column).
We note that besides the strength of the [O II] nebular emission line, its detection also depends on the quasar continuum flux level (see Noterdaeme et al. 2010). Thus, for 120 out of 170 systems, where the [O II] SNR is at < 2σ level, we further investigated whether the sources detected in HSC images at quasar proximity are genuine USMgII host galaxies. For this, we generated the spectral stack to detect the [O II] nebular emission and detected an emission line at the 4.2σ level. We detected a strong [O II] emission at the 11.3σ level when we considered all 170 systems with and without individual [O II] detection. This reiterates that most of our detections are genuine USMgII absorber host galaxies.
Next, ascertaining the availability of a minimum of four HSC passbands, we classified 175 sight lines with no potential host galaxy detected within the search radius of 1.5″ as “clear” sight lines. For this subset, we detected a non-zero flux at the [O II] position, with a marginal detection at the 2.8σ level (see Fig. 1, panel d). This faint signal may likely be contributed by the extended [O II] emission from a distant galaxy (Perrotta et al. 2024) or a galaxy group (Chen et al. 2019), or it suggests the presence of nearby faint galaxies producing the USMgII absorbers (see Sect. 4.1). The clean quasar subtracted images are shown in the bottom two rows of Fig. 1. The summary of the USMgII systems with [O II] detection is listed in the fourth column of Table 1.
3.3. Multiband spectral energy distribution modeling
In this section, we employ a multiband SED model to investigate the absorber-galaxy connection based on photometric redshifts and constrain the key physical parameters of USMgII galaxies. For a wide redshift range, 0.4 ≤ z ≤ 1.7, of our USMgII galaxies, the filter set must be chosen to cover various key spectral features in SED modeling. For instance, the Balmer/4000 Å break that is sensitive to the age and metallicity of stellar populations has shifted between the r and J bands. In addition, the UV excess, particularly at wavelengths shorter than 2500 Å (which are indicative of ongoing star formation activity), is covered between the g and i bands.
Apart from the HSC optical passbands, we also searched for near-infrared (J, H, Ks) passband images from the VISTA Surveys3. Among all the 168 sight lines, we found 3, 29, and 58 quasars covered in the VIDEO (at 5σ depth of J = 24.5, H = 24.0, Ks = 23.5), VIKING (at 5σ depth of J = 22.1, H = 21.5, Ks = 21.2), and VHS (at 5σ depth of J = 21.2, H = 20.6, Ks = 20.0) survey, respectively. For the near-IR flux measurement, we employed forced photometry using the Source Extractor based on the aperture from HSC images. We corrected the HSC apertures to match the seeing of about 0.8″ offered by VISTA. In the case of non-detection, we estimated flux upper limits at the 3σ level. Furthermore, we used the unWISE, W1, and W2, fluxes for the sources along 75 sight lines from the Dark Energy Camera Legacy Survey (Dey et al. 2019). To obtain more secure results, we demanded that the target be detected (at the 3σ level) in any of the four filters mentioned, resulting in 156 sources.
The multiband photometric fluxes were modeled using BAGPIPES4 (Carnall et al. 2018) and the MultiNest sampling algorithm (Feroz et al. 2009). For this, we used a simple model considering a delayed star formation history with a wide parameter space for age (between 50 Myr and 13.5 Gyr), mass (6 ≤ log(M*/M⊙)≤13), and metallicity (0.005 < [Z/H] < 5). We assumed the dust extinction law of Calzetti et al. (1994) with total extinction 0 < Av < 4.
We first modeled the galaxies by varying the redshift over a range of 0.4 ≤ z ≤ 2.0. Interestingly, despite the limited band measurement and large associated uncertainties, we found that about 82 out of the 156 sources match the absorber redshift within a typical photometric error of Δz/(1 + zspec)≤0.15 (Ilbert et al. 2006; see Fig. 2). We recall that apart from the direct detection of [O II] nebular emission at the ≥2σ level, the strong [O II] emission in the stacked spectrum signifies that most of our detections are legitimate USMgII host galaxies. Therefore, we further modeled the galaxies by fixing the redshift within zabs ± 1000 km s−1. We obtained a good fit for an additional 48 of the 156 absorbers, resulting in a total of 130 absorber hosts (see fourth column of Table 1). In the case of multiple absorbers along a quasar sight line, if the photometric redshift matches with any other absorber, we dropped the galaxy from our detection set (see Table 1, Category II). Using 86 out of the above 130 absorbers with the [O II] < 2σ level and best photo-z estimates, we further generated the spectral stack to detect the [O II] nebular emission. A color composite image for this subset is shown in rows four to seven of Fig. 1. We detected a [O II] emission line at the 3.1σ level (see Fig. 1, panel b). Finally, we considered all the 130 systems with and without [O II] detection, and we detected a clear [O II] λλ3727, 3729 doublet profile in the composite spectrum at the 10.5σ level (see Fig. 1, panel c). The higher detection fraction, along with the observed [O II] emission, reaffirm that these sources are genuine USMgII galaxies.
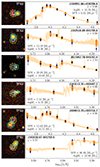 |
Fig. 2. Best-fit SED of host galaxies associated with USMgII absorbers. The postage stamp HSC color composite images, centered on the quasar, are depicted with gray contours. The SDSS fiber, with a radius of 1.5″, is indicated by a dashed yellow circle, while the cyan-colored aperture highlights the USMgII host galaxy. The second column exhibits the corresponding multiband best-fit SED model at the absorber redshift. |
In summary, utilizing the [O II] nebular emission detected on top of individual quasar spectra, we detected 50 USMgII host galaxies. Additionally, based on [O II] emission in the stacked spectra, in conjunction with the photometric redshift estimates, we detected 86 potential absorber galaxies, resulting in a total detection of 136 USMgII galaxies along 412 sight lines in deep HSC images. Among them, six absorbers were selected solely based on the [O II] nebular emission line due to limited HSC passbands. Hereafter, the subset of 130 galaxies with best-fit SED model parameters were employed to study the galaxy properties in detail. The catalog is available at CDS.
3.4. Galaxy geometry
To infer the distribution of the metal contents and the gas dynamics in the circumgalactic medium of USMgII hosts, we first measure the azimuthal angle (ϕ) of the quasar sight line with respect to the galaxy’s major axis. For this, we model the galaxy with a sérsic profile and estimate the galaxy ellipticity ( ), and position angle on deep HSC images (Lundgren et al. 2021). Since ϕ measurement requires a robust estimate of galaxy position angle, we select the galaxies subset with higher ellipticity, e > 0.2, and consistent measurement of position angle in all the available HSC filters. Finally, visual scrutiny is carried out to remove the outliers, including any possible merger or cases with galaxy on top of quasars, and to generate a subsample for examining the dependence of absorber property on azimuthal angle. We have found 40 systems with a robust position angle measurement and high ellipticity e > 0.2.
4. Results
4.1. Detection rate of USMgII absorber galaxies
In the early efforts to map the host galaxies and environments of USMgII absorbers, Nestor et al. (2007) utilized the deep optical images that revealed the existence of at least one bright galaxy with luminosity ≥0.3 L⋆ within an impact parameter of 40 kpc at redshifts of 0.42 < z < 0.84. Recent efforts using advanced integral field spectroscopy techniques have revealed that multiple galaxies may be associated with the strong Mg II absorber. In MusE GAs FLOw and Wind (MEGAFLOW) survey, Schroetter et al. (2019) studied the circumgalactic medium around z ∼ 1 star-forming galaxies and detected one or more galaxies for 59/79 (75%) systems with stellar masses (M⋆) from 109 to 1011 M⊙. Dutta et al. (2020) have searched the absorber host galaxies with SFR and stellar mass down to 0.1 M⊙ yr−1 and 107 M⋆, respectively, around quasar out to ≈200 kpc. They observed a high detection rate of 78%, with 67% Mg II absorbers associated with the non-isolated environments. Lundgren et al. (2021) reported an exceptionally high detection rate of ∼89% for strong Mg II systems in the deep, high-resolution 3D HST survey over an impact parameter of 200 kpc and SFR limit of > 1.3 M⊙ yr−1 at z = 1. Although the handful of efforts mentioned above provide the 3D view with high spatial resolution and sensitivity, have been limited and time-expensive, which largely missed the absorber counterparts at low-impact parameters. Guha et al. (2022, 2024) have targeted the bright galaxies with mr < 23.6 for long-slit spectroscopy observations. They detect massive galaxies (M⋆ > 1010.2 M⊙, survey completeness of 0.3 L⋆) with about 29% of the systems likely associated with isolated galaxies while ∼21% are in groups. However, in 50% cases, no potential host is identified based on either spectroscopic or photometric redshift within 50 kpc.
Within our large sample of USMgII absorbers, probing stellar mass down to 108.65 M⊙ derived from BAGPIPES, we detect a galaxy up to 23 kpc (2.9″) for 40% of the cases, where the 2 Re falls within the fiber radius of 1.5″. We obtain a detection rate of 38% by stipulating an availability of at least four HSC passbands to detect the galaxy. The detection rate as a function of redshift is shown in Fig. 3, which remains broadly consistent at 30−40%. For these USMgII systems the direct [O II] detection rate, at 2σ level, in the SDSS fiber spectrum is 29% which raises to ∼44% if we consider the detection threshold of ∼1.5σ level. This further aligns with the expectations based on the observed strong [O II] nebular emission in the stacked spectra (Noterdaeme et al. 2010; Ménard et al. 2011; Joshi et al. 2018) as well as observed anticorrelation between W2796 vs impact parameter (Chen et al. 2010; Nielsen et al. 2013).
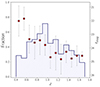 |
Fig. 3. Distribution of the detection rate of USMgII absorber galaxies with redshift. The square shows the average r-band magnitude of galaxies per redshift bin, along with the 16th and 84th percentiles. |
Furthermore, we note that for 60% of absorbers, no counterpart is detected in individual filters at 3σ level or even in the stacked images. Whereas for 9.7% of cases, a nearby faint source is seen in the stacked images. It suggests that a handful of USMgII systems are either hosted by dusty star-forming galaxies, post-starburst galaxies, or very faint/dwarf galaxies. It is pertinent to recall that we detected [O II] emission line signature along the clear sight lines, indicating the possible presence of faint galaxies. Therefore, such systems are also potential dark galaxy candidates (Matsuoka et al. 2012; Straka et al. 2013), and they are explored further in Das et al. (in preparation). One such example for the quasar sight line J234451.70+000603.2 is shown in Fig. 4, where the [O II] line signature is detected at the 3.2σ level, but a potential host is only discernible in the stacked image. Further, spectroscopic and deep imaging follow-up of these cases will help to confirm and study the origin of USMgII absorbers in faint galaxy population.
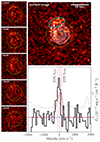 |
Fig. 4. A potential galaxy candidate from the faint end population at zabs = 1.018, along J234451.70+000603.2 quasar sight line at zqso = 2.4. Left panel: The postage stamp HSC multiband images after quasar removal. Top right panel: HSC five band median co-added image showing a potential host galaxy detected at 2.7σ level, marked as cyan aperture. The SDSS fiber, with a radius of 1.5″, is indicated by a dashed circle whereas the quasar is shown as contours. Bottom right panel: An emission signature at the expected [O II] λλ3727, 3729 wavelength, detected at ∼3.2σ level. |
4.2. Star formation rate in USMgII host galaxies
As evidenced by the SFR and W2796 correlation, the USMgII galaxies are often found to likely be starburst in nature. Bouché et al. (2007) have observed 21 very strong MgII absorbers with W2796 > 2 Å at z ∼ 1 using VLT/SINFONI near-infrared IFU and detected the majority of absorber host galaxies with ρ ranging from 0.2 to 4 arcsec (i.e., ρ ≤ 25 kpc) with the SFR (Hα) between 1 and 20 M⊙ yr−1. Taking advantage of the large 3D view offered by MUSE/VLT, the MEGAFLOW survey has studied nine systems with strong W2796 > 2 Å over 0.8 < z < 1.6. They found all but one absorber galaxy to have SFRs greater than 2.5 M⊙ yr−1, with the average impact parameter of 22 kpc. In long-slit observations of the galaxies near the quasar, Guha et al. (2022, 2024) have targeted 63 USMgII absorbers and found a high detection rate of ∼50% at an average ρ ∼ 19 kpc. The stellar mass for their USMgII galaxies is in the range of 10.2 ≤ log M⋆[M⊙]≤12.01 with an average log M⋆ = 10.73 M⊙. These galaxies have been found to have an average SFR of ∼21.16 M⊙ yr−1.
We note that in the SDSS and BOSS finite fiber radius of 1.5″ and 1″, respectively, only a part of the galaxy comes into the fiber. As a result, our measured SFR inferred from [O II] nebular emission is a lower limit. Among the 50 USMgII galaxies with direct [O II] detection, for 15 galaxies the SFR based on SED is consistent with [O II]-based SFR. Hence, here we relied on SED model-based SFR measurements. For the USMgII galaxies with an SFR ranging between 0.01 and 340 M⊙ yr−1, the average SFR of the USMgII galaxies was found to be 30.72 M⊙ yr−1.
In general, the metal absorber properties (e.g., metallicity, the strength of W2796) are interlinked with the galaxy properties, such as M⋆ and SFR (Lan et al. 2014; Rubin et al. 2018; Dutta et al. 2020). In addition, a color dependence is often also observed, showing that the star-forming galaxies host stronger absorbers than the passive ones (Lan & Mo 2018; Bordoloi et al. 2011, but see also Chen et al. 2010). To examine the dependence of USMgII metal absorption on the host galaxy properties, we calculated Kendall’s τ-coefficient of W2796 with M⋆ and found a weak positive correlation with τk = 0.13 and a null probability of pk = 0.03. The W2796 is also correlated with the SFR (τk = 0.10 and pk = 0.10), albeit weaker than the correlation found for W2796 and M⋆. As the metal enrichment of the CGM is the result of supernovae, the ratio of α-elements to Fe should reflect the supernova rates and the efficiency of outflows enriching the CGM. Therefore, we studied the link of M⋆ and SFR with the equivalent width of Fe IIλ2600 (W2600), tracing 104 K gas, and the equivalent width ratio between Mg IIλ2796 and Fe IIλ2600 (R = W2796/W2600). Both the W2600 (τk = 0.12, pk = 0.04) and R parameter (τk = 0.11, pk = 0.05) mildly correlated with SFR, whereas no such dependence was seen with stellar mass. This likely highlights the role of supernova-driven galactic outflows in the metal enrichment of the CGM. Interestingly, the USMgII absorbers along the “clear” sight lines show a relatively lower median R = 0.57 ± 0.01 compared to the “detection” set with R = 0.64 ± 0.01. A two-sided Kolmogorov–Smirnov test revealed a significant difference based on the R parameter between the “clear” and “detection” subsets, with a null probability of being drawn from the same parent distribution to be PKS = 0.004. As both Mg II and Fe II absorption are likely saturated at the SDSS resolution, the difference in R may likely be related to the difference in kinematic spread of the gas, which is essentially driven by the SFRs. This also supports the previous findings where Mg II systems with strong W2600 are found to have strong [O II] luminosity. Such a high R is likely to arise in high metallicity sub-DLAs or high N(HI) DLAs (Srianand 1996) and trace the Mg II absorber hosts with higher star formation (Joshi et al. 2017a, 2018).
In Fig. 5, we compare the SFR of USMgII galaxies versus stellar mass with the best-fit relation for main sequence star-forming galaxies at 0.5 ≤ z ≤ 1 and 1 ≤ z ≤ 2 from Bisigello et al. (2018). The points are color-coded with the absorber redshift. Our USMgII absorbers span over a stellar mass of 8.65 ≤ log M⋆[M⊙]≤11.67, with an average log M⋆ of 9.90 M⊙. A noticeable rise in SFR with stellar mass is evident in Fig. 5. The subsets below and above the average log M⋆ have median SFR of 5.48 (±0.7 dex) and 30.29 (±1.6 dex) M⊙ yr−1, respectively. In the top panel of Fig. 5, we compare the SFR, normalized by the main sequence star-forming galaxies of similar mass and redshift, obtained from the best-fit relation by Popesso et al. (2023). It is worth noting that star-forming galaxies often face significant dust obscuration, resulting in an underpredicted SFR by a factor of two to three in SED modeling routines (Wuyts et al. 2009). It is clear from Fig. 5 that USMgII absorber host galaxies are broadly consistent with the main sequence star-forming galaxies. Interestingly, around 21% of galaxies exhibit a starburst nature characterized by their SFRs being more than three times that of main sequence galaxies (Elbaz et al. 2018). Furthermore, the USMgII galaxies meet the threshold SFR for launching strong outflows (Murray et al. 2011), shown with dotted lines in Fig. 5.
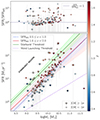 |
Fig. 5. Main sequence, SFR versus stellar mass, USMgII absorber host galaxies. The dashed-blue and solid-red lines depict the best linear fit for main sequence galaxies at 0.5 ≤ z < 1 and 1 ≤ z < 2, respectively while the solid-green line represents the sequence for starburst galaxies from Bisigello et al. (2018). The symbols are color-coded with the redshift. The shaded and hatched regions indicate the 1σ confidence interval. Additionally, the dotted-line represents the SFR threshold for wind launching from Murray et al. (2011). Top panel: SFR of USMgII galaxies normalized by the main sequence star-forming galaxy at respective redshift. |
4.3. Equivalent width versus impact parameter
The numerous attempts to establish a connection between absorbers and galaxies have revealed an anticorrelation between W2796 and the impact parameter (ρ). It is interpreted as a decrease in the fraction of low-ionization metal-enriched gas with increasing distance from the galaxy core (Chen et al. 2010; Nielsen et al. 2013). Additionally, the significant dispersion observed in the W2796 versus ρ relation is influenced by factors such as galaxy stellar mass (Chen et al. 2010; Dutta et al. 2020), host inclination angle (Kacprzak et al. 2011), and the interplay of various physical mechanisms, such as gas inflow and outflow (Bouché et al. 2012). Recently, using an absorption-selected sample, Lundgren et al. (2021) have shown a significant evolution of this anticorrelation across a range of redshifts from z ∼ 0.4 to z ∼ 1.5 (but see also Dutta et al. 2020). Additionally, Lan (2020) reported a strong co-evolution of gas covering fraction around star-forming galaxies over the redshift range from z ∼ 0.4 to z ∼ 1.3, with a strong dependency on galaxy stellar mass.
The W2796 versus ρ relation for all the 136 USMgII hosts detected in this work is presented in Fig. 6. The ρ spans ∼5.2 kpc to ∼23 kpc, with a median ρ of ∼11.4 kpc. The above ρ for the USMgII hosts are much larger than the predicted ρ ≲ 5 kpc by the W2796 − ρ anticorrelation at z ∼ 0.5 (Nielsen et al. 2013) and at z ∼ 1.0 (Lundgren et al. 2021), respectively. Recently, Guha et al. (2022, 2024) reported a broad impact parameter ranging between 6.3 kpc and 120 kpc for 38 USMgII absorber host galaxies between z ∼ 0.4 and 0.8. However, it is important to note that instead of originating at such large impact parameters, the USMgII absorbers could be due to unseen galaxies (see Sect. 4.1).
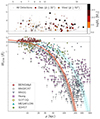 |
Fig. 6. Equivalent width (W2796) versus impact parameter (ρ) relation for MgII galaxies. Bottom panel: W2796 versus ρ distribution for Mg II galaxies from literature. The best-fit anticorrelation between W2796 and ρ is shown as a solid line along, and the 16th and 84th percentiles are indicated as a hatched region. The best-fitting relationships from the literature for z ∼ 1 Mg II systems from Lundgren et al. (2021, dot-dashed line) and a global fit for 0 < z < 1.5 from Guha et al. (2024, dashed line) are also plotted for reference. Top panel: Similar to the above but for only USMgII galaxies (circle), color coded by the M⋆. The quasar-galaxy pairs classified as “wind”, with ϕ ≥ 50°, and “disk”, with ϕ ≤ 30°, are respectively represented with star and square symbols. The wind subset preferentially shows a higher W2796 and a larger scatter relative to the disk subset. |
We modeled the W2796 versus impact parameter using a log-linear model as log W2796 (Å) = α + β × ρ (kpc), with a likelihood function given in Eq. (7) of Chen et al. (2010) (see also Dutta et al. 2020), and we sampled the posterior probability density function using PyMultiNest. For this, we included the W2796 and impact parameter measurements from the literature, including from the MAGIICAT sample (Nielsen et al. 2013), the MEGAFLOW survey (Schroetter et al. 2019), the MAGG survey (Dutta et al. 2020), Huang et al. (2021), 3D-HST (Lundgren et al. 2021), and Guha & Srianand (2023), and we obtained a best-fit parameter of  . In cases where multiple galaxies are associated with an absorber, we considered the galaxy with the smallest impact parameter. Figure 6 shows the best-fit log-linear model along with the 1σ uncertainty in the shaded region. It is clear from the figure that the USMgII systems deviate from the best-fit relation at relatively larger impact parameters of ≳15 kpc (see also Guha et al. 2024).
The large scatter observed in W2796 as a function of ρ in Fig. 6 can be reconciled with the various routes contributing to their origin (see Sect. 1). One possible way to address this is to look for the gas origin in galactic winds, which can be seen as an expanding biconical flow perpendicular to the galaxy disk (Nelson et al. 2019), and gas accretion traced as co-rotating gas along the major axis (Zabl et al. 2021). In most cases among our USMgII hosts, only one galaxy is observed around the quasar, providing an opportunity to test whether the absorption originates from outflowing winds or gas inflow. For this, we divided the sample into two subsets, with one part closer to the minor (ϕ > 50°) axis – dubbed the “Wind” subset – and likely to trace the outflowing wind (star) and a second part closer to the major (ϕ < 30°) axis – referred to as the “Disk” subset – and likely to trace gas inflows (square) (see top panel of Fig. 6). These two bins contain a total of 38 systems, with 12 along the major axis and 26 along the minor axis. It is clear from Fig. 6 that the strongest USMgII systems in our sample preferentially belong to the Wind subset. The average W2796 of the USMgII absorbers in the Wind subset is 3.59 ± 0.08 Å, whereas the Disk subset has a slightly lower average W2796 of 3.28 ± 0.06 Å. It is evident that in comparison to the Disk subset, the scatter in W2796 is governed by the Wind subset.
Moreover, a near constant W2796 of the wind subset up to large impact parameters is consistent with the high-resolution cosmological simulations where the galactic winds substantially enhance the amount of cold gas in the halo, as evidenced by high covering fractions of H I and Mg II out to the virial radius and beyond (see Suresh et al. 2019). On the other hand, the Disk subset shows a relatively smaller scatter, suggesting that the interplay between various physical origins (e.g., extended gaseous disks and galactic winds) collectively contributes to the significant dispersion in W2796 − ρ relationship (see also Bouché et al. 2012). Finally, we assessed whether there is any dependence of the W2796 − ρ relation on redshift. We found no significant evolution for USMgII systems over a broad redshift range (0.4 ≤ z ≤ 1.7). This is in agreement with Guha et al. (2024), where no significant redshift evolution was seen for USMgII absorbers within an impact parameter of ≤120 kpc.
4.4. Gas distribution: Azimuthal angle dependence
Earlier attempts to map the distribution of CGM gas involving observations of galaxy samples and stacking experiments have shown a preference for additional absorption to occur along both the major and minor axes of galaxies up to distances of 50 kpc (Bordoloi et al. 2011; Kacprzak et al. 2012; Lan & Mo 2018; Schroetter et al. 2019; Zabl et al. 2019). Moreover, utilizing redshift z ∼ 1 galaxies from the 3D HST survey, Lundgren et al. (2021) identified that this preference toward the semi-minor axis persists up to around ∼80 kpc, signifying the extent of galactic outflows. A strong dependence of Mg II emission as a function of inclination of the central galaxy – where edge-on galaxies clearly show enhanced emission along the minor axis, while face-on galaxies show weaker and isotropic emission – supports biconical outflowing geometry perpendicular to the galactic disk (Guo et al. 2023). The tendency for strong absorbers to cluster near the minor axis is commonly associated with starburst-driven outflows, while the excess absorption near the galaxy’s major axis is attributed to gas accretion. Such an isotropic gas distribution, with a higher average metallicity along the minor versus major axes of galaxies, has also been seen in cosmological hydrodynamical simulations (Péroux et al. 2020).
Utilizing our dataset of USMgII absorbers, which effectively maps the CGM at low impact parameters where gas flows are more pronounced, we examined their azimuthal angle dependence. We additionally incorporated 8 strong absorbers (W2796 ≥ 2 Å), including a USMgII system found in the Wind subset, from the MEGAFLOW survey (Zabl et al. 2019, 2021) that are characterized by low impact parameters and reliable galaxy morphology measurements. In Fig. 7, we show the azimuthal angle distribution for the “Wind” and “Disk” subset, comprising of a total of 38 systems with 12 along the major axis and 26 along the minor axis (see Sect. 4.3). It is clear from Fig. 7 that the strongest USMgII systems in our sample are preferentially observed along the direction of galactic winds. For instance, among three absorbers with W2796 > 4 Å, none of them are observed along the major axis. This is further supported by a KS test which rejects the null hypothesis of the two distributions being drawn from the same parent population at PKS = 0.084. At first glance in Fig. 7, an evident preference for the azimuthal angle appears to exist. To quantify this further, we divided the sample into three equal azimuthal angle bins of 30° each. The ϕ bins of 0° −30° and 60° −90°, that is, close to the direction of the major axis and minor axis, comprise 30% (12) and 52% (21) of the total 40 USMgII systems, respectively. The lowest average number of absorbers, that is, 18% (7) systems, are observed along the ϕ ∼ 30° −60° bin, hinting at bimodality in the absorber distribution.
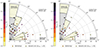 |
Fig. 7. Distribution of Mg II absorbers as a function of azimuthal angle (ϕ) for the USMgII host galaxies. Left panel: The ϕ distribution for USMgII galaxies with ellipticity e ≥ 0.2. The symbol size represents the W2796/W2600, with the color denoting the strength of the equivalent width (W2796). Right panel: Same as the left panel but for the subset with an ellipticity of e ≥ 0.3. The histogram shows the cumulative ϕ distribution of the USMgII absorber below (gray region) and above (yellow region) the median impact parameter of 11.4 kpc, respectively. |
Using the high-resolution TNG50 cosmological simulation, DeFelippis et al. (2021) compared the CGM of z ∼ 1 star-forming galaxies with strong Mg II absorbers (W2796 > 0.5 Å) from the MEGAFLOW survey. Contrary to the result from observations, they showed that Mg II absorption along the minor axis is weaker than along the major axis, with no net Mg II outflows along the minor axis (see also Ho et al. 2020). In addition, they showed that the azimuthal dependence of absorbers is very sensitive to the inclination angle of the sight line. Therefore, we tested the azimuthal angle dependence with a stringent ellipticity of e > 0.3. A striking bimodal distribution of USMgII absorbers is evident, with the majority of absorbers seen within 30° of the major and minor axis (see Fig. 7). This implies that the cool gas traced by ultra-strong Mg II absorbers likely emanates from outflows propelled along the minor axis and IGM gas accretion in conjunction with the fountain flows, ISM, and satellite galaxies, leading to the wide velocity spread along the major axis (Guo et al. 2023; Rubin et al. 2022; Perrotta et al. 2024).
We further investigated the ϕ dependence on galaxy properties governing the outflows (e.g., sSFR) and Fe II/Mg II abundance ratio (R). The average sSFR along the wind and inflow direction was found to be log(sSFR/yr−1) = −8.80, which indicates that USMgII systems are hosted in galaxies with a high sSFR. The R was also found to be similar, with an average R = 0.62, which indicates that at average impact parameters of 11.4 kpc traced in our sample, the gas along the wind and disk plane is highly metal enriched.
4.5. USMgII gas properties along detection versus “clear” sight lines
Strong Mg II systems generally trace a large amount of neutral gas. In a low-redshift (z < 1.65) study of Mg II absorbers with W2796 > 0.3 Å, Rao et al. (2006) found that all the DLA systems (log N(HI)[cm−2]> 20.3) have W2796 > 0.6 Å. This suggests that most of our USMgII systems may likely be DLAs. To explore this further, we compared the metal content in USMgII absorbing gas along the detection set tracing the galaxy halo and the clear sight lines, with no galaxy detected within 20 kpc. To derive the typical metal content, we produced a median-stacked spectrum by using the spectral region redward of the Lyα forest for both the detection and clear subset, thus consisting of 136 and 178 absorbers, respectively. We detected high ionization lines (Si IV, C IV); low ionization lines (Fe II, Si II, Zn II, Cr II, Mg I); and weak transition lines (Fe IIλλ2249,2260, Ni II). We modeled the metal lines as a single Gaussian profile to measure the rest-frame equivalent widths. The rest equivalent widths of Zn IIλλ2026,2062 Å were estimated by removing the blending with Mg Iλ2026 and Cr IIλ2062 as described by York et al. (2006). It is worth noting that despite the small apparent optical depth, most of the lines are saturated due to the low spectral resolution of SDSS (R ∼ 2000). We estimated the column density for various species using the curve of growth of different absorption lines that originate with a broad range of oscillator strengths (Jenkins 1986; Noterdaeme et al. 2014; Joshi et al. 2017b).
In Fig. 8, we show the relative abundance ratio between the refractory element (Si, Fe) over the volatile element Zn for our detection and clear subsets. The USMgII absorber galaxies exhibit gas depletion patterns broadly consistent with DLAs (Mas-Ribas et al. 2017) and the halo of the Milky Way reported by Welty et al. (1999). We found a similar depletion pattern along the detection and clear sight lines. For the clear sight lines, the Fe II is depleted by a factor of two higher than the DLAs, suggesting a substantial dust content; however, more data would be helpful to test this further. Given that the gas along clear sight lines might be associated with a faint galaxy at a small impact parameter, a halo of a massive galaxy at a large impact parameter, and/or intra-group gas, a follow-up study tracing the large-scale environment would further help to explore the origin of metal-rich gas.
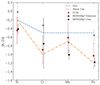 |
Fig. 8. Relative abundances, [X/Zn], along detection versus clear sight lines for several species compared with the depletion patterns of the Milky Way halo (dashed line) and warm disk (dashed-dot line) gas from Welty et al. (1999). The zero point of the ordinate corresponds to the solar metallicity. |
4.6. Environment of USMgII absorbers
Finally, we tested if the USMgII absorber sight lines on average exhibit more sources at absorber redshift compared to the randomly selected field. For this, we selected a control sample of ten quasars (with a minimum of five quasars) from the SDSS quasar catalog along each USMgII sight line that match in both redshift and magnitude, ensuring uniform levels of reddening and source density. Using the photometric sources within 30 arcsec around the quasar from deep HSC imaging, we estimated the excess surface density of galaxies out to 200 kpc, which is shown in Fig. 9. We observed a factor of three higher overdensity of galaxies along the USMgII sight lines at ρ ≲ 50 kpc in comparison to larger impact parameters. In the present study, the direct detection of 38% galaxies in proximity to quasars at an average impact parameter within ρ ≤ 11.4 kpc supports the excess galaxy density. Nestor et al. (2007) have reported an excess number of galaxies, with every sight line hosting at least one galaxy at an impact parameter ρ ≲ 40 kpc and a luminosity L ≳ 0.3 L⋆.
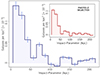 |
Fig. 9. Excess surface density of galaxies along USMgII sight lines as a function of impact parameter with respect to a control quasar set of similar redshift and color. A clear overdensity of galaxies is evident for ρ ≲ 50 kpc. The inset shows the same for galaxies selected based on photometric redshift. |
We then matched the absorber redshift with the HSC photometric redshift of galaxies within σ[Δz/(1 + z)] ≤ 0.1 and found an excess at impact parameters of ≲50 kpc (see inset in Fig. 9). We note that the excess overdensity is a lower limit since it is an average over a wide redshift range, resulting in varying mass limits. The MAGG survey (Dutta et al. 2020), which mapped the gas-galaxy association up to ∼200 kpc from quasars, revealed that ∼67% of absorbers are associated with multiple galaxies. Taking advantage of HSC photometric redshifts, we explored the gas-galaxies association within an impact parameter of 200 kpc. The HSC photometric redshift-based association of galaxies with USMgII absorbers, including our detections, revealed that about 14% of the absorbers are likely produced by a single galaxy, whereas 17% of the absorbers are associated with a galaxy pair, and 66% of the absorbers likely trace the merger or group environments, which is consistent with the MAGG survey. This outcome suggests that, apart from the strong outflows, the wide velocity spread in USMgII absorbers originates from the galaxy-galaxy interaction (see Guha et al. 2022), and it reiterates the importance of a large-scale IFU survey to study the gas-galaxy connection. The excess surface density of galaxies and a large fraction (62%) of sight lines without a nearby potential host galaxy (i.e., clear cases) in the present study suggest that in addition to the gas inflows and outflows, the galaxy pairs and intra-group medium may likely contribute to the kinematically complex absorption profile of USMgII systems.
5. Conclusion
Utilizing the deep high-resolution optical imaging data provided by the Subaru HSC-SSP Survey, we investigated the characteristics of galaxies associated with USMgII absorbers. Augmented by deep IR imaging data from the VISTA survey and spectral data from the SDSS survey, we identified 136 USMgII galaxies in proximity to quasars across a broad redshift range of 0.4 ≤ z ≤ 1.7. The morpho-kinematic analysis of these elusive systems resulted in the following key findings:
-
We detected USMgII galaxies in proximity to the quasar, with an impact parameter ranging between 5.2 ≤ ρ ≤ 23 kpc, in approximately 40% of cases. For the average impact parameter of < 12 kpc, considering the availability of a minimum of four HSC passbands, we obtained a detection rate of 38%. For 50 systems, we detected [O II] nebular emission at the ≥2σ level, while a strong [O II] emission was observed in the stacked spectrum for the entire subset, which likely originated in the outflows or extended gaseous disk. However, for 60% (204 out of 340) of the absorbers, no counterpart was detected in close quasar proximity. The quasar sight line hosting a USMgII absorber, compared to a control quasar sample of similar redshift and color, showed a factor of three higher galaxy surface density of ∼0.00031 galaxies per kpc2, especially at an impact parameter of ≲50 kpc.
-
The galaxies hosting USMgII absorbers in our sample exhibit a broad stellar mass distribution ranging from 8.65 ≤ log M⋆[M⊙]≤11.67, with an average SFR of 30.72 M⊙ yr−1. These galaxies generally exhibit the SFRs of typical main sequence star-forming galaxies. About 21% of the USMgII galaxies show a starburst nature, whereas all of them meet the threshold SFR for launching strong outflows.
-
In contrast to the observed anticorrelation between W2796 and ρ in the literature, the USMgII absorbers show a significant scatter in W2796 out to ∼25 kpc. Considering the bi-conical wind geometry, the USMgII systems with large azimuthal angles tracing the outflows exhibit near-constant W2796 up to large impact parameters. In addition, the wind subset shows preferentially stronger W2796 than the ones produced in the extended disk. A strong preference of the USMgII systems along the direction of outflow (ϕ ≥ 50°) or extended galactic disk (ϕ ≤ 30°) and the large scatter in W2796 as a function of ρ supports their wind and disk origin.
Finally, the non-zero [O II] emission along clear sight lines that have no discernible stellar counterpart in the deep Subaru HSC images with a typical depth of rmag ∼ 26 likely are potential dark galaxies. This is further corroborated by a few instances where no galaxy counterpart is observed in any of the g, r, i, z, y bands. In contrast, a faint galaxy counterpart was detected in co-added multiband HSC image frames (Das et al., in preparation). The USMgII origin may also be related to satellites of log M⋆ < 108 M⊙ around a central log M⋆ < 109 M⊙ galaxy within a typical Δv ranging from ∼70 to 250 km s−1, which accounts for ∼40% of the absorber fraction up to the virial radius in the TNG 50 simulation (see Weng et al. 2024). Multiband imaging and spectral follow-up of these sight lines will contribute to understanding the effects of strong outflows on galaxy growth across a range of masses.
Data availability
The catalog is available at the CDS via anonymous ftp to cdsarc.cds.unistra.fr (130.79.128.5) or via https://cdsarc.cds.unistra.fr/viz-bin/cat/J/A+A/695/A206
Acknowledgments
LCH was supported by the National Science Foundation of China (11991052, 12233001), the National Key R&D Program of China (2022YFF0503401), and the China Manned Space Project (CMS-CSST-2021-A04, CMS-CSST-2021-A06). RJ was supported by the DST-SERB SRG grant 001785. HMY was partially supported by the Research Fund for International Young Scientists of NSFC (11950410492) and JSPS KAKENHI Grant Number JP22K14072. The Hyper Suprime-Cam (HSC) collaboration includes the astronomical communities of Japan and Taiwan, and Princeton University. The HSC instrumentation and software were developed by the National Astronomical Observatory of Japan (NAOJ), the Kavli Institute for the Physics and Mathematics of the Universe (Kavli IPMU), the University of Tokyo, the High Energy Accelerator Research Organization (KEK), the Academia Sinica Institute for Astronomy and Astrophysics in Taiwan (ASIAA), and Princeton University. Funding was contributed by the FIRST program from Japanese Cabinet Office, the Ministry of Education, Culture, Sports, Science and Technology (MEXT), the Japan Society for the Promotion of Science (JSPS), Japan Science and Technology Agency (JST), the Toray Science Foundation, NAOJ, Kavli IPMU, KEK, ASIAA, and Princeton University. This paper makes use of software developed for Vera C. Rubin Observatory. We thank the Rubin Observatory for making their code available as free software at http://pipelines.lsst.io/. This paper is based on data collected at the Subaru Telescope and retrieved from the HSC data archive system, which is operated by the Subaru Telescope and Astronomy Data Center (ADC) at NAOJ. Data analysis was in part carried out with the cooperation of Center for Computational Astrophysics (CfCA), NAOJ. We are honored and grateful for the opportunity of observing the Universe from Maunakea, which has the cultural, historical and natural significance in Hawaii. The Pan-STARRS1 Surveys (PS1) and the PS1 public science archive have been made possible through contributions by the Institute for Astronomy, the University of Hawaii, the Pan-STARRS Project Office, the Max Planck Society and its participating institutes, the Max Planck Institute for Astronomy, Heidelberg, and the Max Planck Institute for Extraterrestrial Physics, Garching, The Johns Hopkins University, Durham University, the University of Edinburgh, the Queen’s University Belfast, the Harvard-Smithsonian Center for Astrophysics, the Las Cumbres Observatory Global Telescope Network Incorporated, the National Central University of Taiwan, the Space Telescope Science Institute, the National Aeronautics and Space Administration under grant No. NNX08AR22G issued through the Planetary Science Division of the NASA Science Mission Directorate, the National Science Foundation grant No. AST-1238877, the University of Maryland, Eotvos Lorand University (ELTE), the Los Alamos National Laboratory, and the Gordon and Betty Moore Foundation. Funding for the Sloan Digital Sky Survey IV has been provided by the Alfred P. Sloan Foundation, the U.S. Department of Energy Office of Science, and the Participating Institutions. SDSS-IV acknowledges support and resources from the Center for High-Performance Computing at the University of Utah. The SDSS website is www.sdss.org. SDSS-IV is managed by the Astrophysical Research Consortium for the Participating Institutions of the SDSS Collaboration, including the Brazilian Participation Group, the Carnegie Institution for Science, Carnegie Mellon University, the Chilean Participation Group, the French Participation Group, Harvard Smithsonian Center for Astrophysics, Instituto de Astrofísica de Canarias, The Johns Hopkins University, Kavli Institute for the Physics and Mathematics of the Universe (IPMU)/University of Tokyo, the Korean Participation Group, Lawrence Berkeley National Laboratory, Leibniz Institut für Astrophysik Potsdam (AIP), Max-Planck-Institut für Astronomie (MPIA Heidelberg), Max-Planck-Institut für Astrophysik (MPA Garching), MaxPlanck-Institut für Extraterrestrische Physik (MPE), National Astronomical Observatories of China, New Mexico State University, New York University, University of Notre Dame, Observatário Nacional/MCTI, The Ohio State University, Pennsylvania State University, Shanghai Astronomical Observatory, United Kingdom Participation Group, Universidad Nacional Autónoma de México, University of Arizona, University of Colorado Boulder, University of Oxford, University of Portsmouth, University of Utah, University of Virginia, University of Washington, University of Wisconsin, Vanderbilt University, and Yale University.
References
- Abazajian, K. N., Adelman-McCarthy, J. K., Agüeros, M. A., et al. 2009, ApJS, 182, 543 [Google Scholar]
- Aihara, H., AlSayyad, Y., Ando, M., et al. 2022, PASJ, 74, 247 [NASA ADS] [CrossRef] [Google Scholar]
- Alam, S., Albareti, F. D., Allende Prieto, C., et al. 2015, ApJS, 219, 12 [Google Scholar]
- Anand, A., Kauffmann, G., & Nelson, D. 2022, MNRAS, 513, 3210 [NASA ADS] [CrossRef] [Google Scholar]
- Bertin, E., & Arnouts, S. 1996, A&AS, 117, 393 [NASA ADS] [CrossRef] [EDP Sciences] [Google Scholar]
- Bertin, E., Mellier, Y., Radovich, M., et al. 2002, ASP Conf. Ser., 281, 228 [Google Scholar]
- Bielby, R., Crighton, N. H. M., Fumagalli, M., et al. 2017, MNRAS, 468, 1373 [CrossRef] [Google Scholar]
- Bisigello, L., Caputi, K. I., Grogin, N., & Koekemoer, A. 2018, A&A, 609, A82 [NASA ADS] [CrossRef] [EDP Sciences] [Google Scholar]
- Bond, N. A., Churchill, C. W., Charlton, J. C., & Vogt, S. S. 2001, ApJ, 562, 641 [NASA ADS] [CrossRef] [Google Scholar]
- Bordoloi, R., Lilly, S. J., Knobel, C., et al. 2011, ApJ, 743, 10 [CrossRef] [Google Scholar]
- Bouché, N., Murphy, M. T., Péroux, C., et al. 2007, ApJ, 669, L5 [CrossRef] [Google Scholar]
- Bouché, N., Hohensee, W., Vargas, R., et al. 2012, MNRAS, 426, 801 [CrossRef] [Google Scholar]
- Calzetti, D., Kinney, A. L., & Storchi-Bergmann, T. 1994, ApJ, 429, 582 [Google Scholar]
- Carnall, A. C., McLure, R. J., Dunlop, J. S., & Davé, R. 2018, MNRAS, 480, 4379 [Google Scholar]
- Carr, C., Bryan, G. L., Fielding, D. B., Pandya, V., & Somerville, R. S. 2023, ApJ, 949, 21 [NASA ADS] [CrossRef] [Google Scholar]
- Chen, H.-W., Helsby, J. E., Gauthier, J.-R., et al. 2010, ApJ, 714, 1521 [NASA ADS] [CrossRef] [Google Scholar]
- Chen, H.-W., Boettcher, E., Johnson, S. D., et al. 2019, ApJ, 878, L33 [NASA ADS] [CrossRef] [Google Scholar]
- DeFelippis, D., Bouché, N. F., Genel, S., et al. 2021, ApJ, 923, 56 [NASA ADS] [CrossRef] [Google Scholar]
- Dey, A., Schlegel, D. J., Lang, D., et al. 2019, AJ, 157, 168 [Google Scholar]
- Dutta, R., Fumagalli, M., Fossati, M., et al. 2020, MNRAS, 499, 5022 [CrossRef] [Google Scholar]
- Dutta, R., Fossati, M., Fumagalli, M., et al. 2023, MNRAS, 522, 535 [NASA ADS] [CrossRef] [Google Scholar]
- Elbaz, D., Leiton, R., Nagar, N., et al. 2018, A&A, 616, A110 [NASA ADS] [CrossRef] [EDP Sciences] [Google Scholar]
- Feltre, A., Bacon, R., Tresse, L., et al. 2018, A&A, 617, A62 [NASA ADS] [CrossRef] [EDP Sciences] [Google Scholar]
- Feroz, F., Hobson, M. P., & Bridges, M. 2009, MNRAS, 398, 1601 [NASA ADS] [CrossRef] [Google Scholar]
- Fossati, M., Fumagalli, M., Gavazzi, G., et al. 2019, MNRAS, 484, 2212 [NASA ADS] [CrossRef] [Google Scholar]
- Gauthier, J.-R. 2013, MNRAS, 432, 1444 [NASA ADS] [CrossRef] [Google Scholar]
- Guha, L. K., & Srianand, R. 2023, MNRAS, 519, 3319 [NASA ADS] [CrossRef] [Google Scholar]
- Guha, L. K., Srianand, R., Dutta, R., et al. 2022, MNRAS, 513, 3836 [NASA ADS] [CrossRef] [Google Scholar]
- Guha, L. K., Srianand, R., & Petitjean, P. 2024, MNRAS, 527, 5075 [Google Scholar]
- Guo, Y., Bacon, R., Bouché, N. F., et al. 2023, Nature, 624, 53 [NASA ADS] [CrossRef] [Google Scholar]
- Heckman, T. M., Lehnert, M. D., Strickland, D. K., & Armus, L. 2000, ApJS, 129, 493 [Google Scholar]
- Ho, S. H., Martin, C. L., & Schaye, J. 2020, ApJ, 904, 76 [NASA ADS] [CrossRef] [Google Scholar]
- Huang, Y.-H., Chen, H.-W., Shectman, S. A., et al. 2021, MNRAS, 502, 4743 [NASA ADS] [CrossRef] [Google Scholar]
- Ilbert, O., Arnouts, S., McCracken, H. J., et al. 2006, A&A, 457, 841 [NASA ADS] [CrossRef] [EDP Sciences] [Google Scholar]
- Ishino, T., Matsuoka, Y., Koyama, S., et al. 2020, PASJ, 72, 83 [NASA ADS] [CrossRef] [Google Scholar]
- Jenkins, E. B. 1986, ApJ, 304, 739 [NASA ADS] [CrossRef] [Google Scholar]
- Joshi, R., Srianand, R., Petitjean, P., & Noterdaeme, P. 2017a, MNRAS, 471, 1910 [Google Scholar]
- Joshi, R., Srianand, R., Noterdaeme, P., & Petitjean, P. 2017b, MNRAS, 465, 701 [CrossRef] [Google Scholar]
- Joshi, R., Srianand, R., Petitjean, P., & Noterdaeme, P. 2018, MNRAS, 476, 210 [NASA ADS] [CrossRef] [Google Scholar]
- Kacprzak, G. G., Churchill, C. W., Evans, J. L., Murphy, M. T., & Steidel, C. C. 2011, MNRAS, 416, 3118 [NASA ADS] [CrossRef] [Google Scholar]
- Kacprzak, G. G., Churchill, C. W., & Nielsen, N. M. 2012, ApJ, 760, L7 [NASA ADS] [CrossRef] [Google Scholar]
- Kacprzak, G. G., Martin, C. L., Bouché, N., et al. 2014, ApJ, 792, L12 [NASA ADS] [CrossRef] [Google Scholar]
- Kehoe, E., Shapley, A. E., Forster Schreiber, N. M., et al. 2024, ArXiv e-prints [arXiv:2406.07621] [Google Scholar]
- Lan, T.-W. 2020, ApJ, 897, 97 [NASA ADS] [CrossRef] [Google Scholar]
- Lan, T.-W., & Mo, H. 2018, ApJ, 866, 36 [NASA ADS] [CrossRef] [Google Scholar]
- Lan, T.-W., Ménard, B., & Zhu, G. 2014, ApJ, 795, 31 [NASA ADS] [CrossRef] [Google Scholar]
- Lundgren, B. F., Creech, S., Brammer, G., et al. 2021, ApJ, 913, 50 [NASA ADS] [CrossRef] [Google Scholar]
- Mas-Ribas, L., Miralda-Escudé, J., Pérez-Ràfols, I., et al. 2017, ApJ, 846, 4 [NASA ADS] [CrossRef] [Google Scholar]
- Matsuoka, Y., Ienaka, N., Oyabu, S., Wada, K., & Takino, S. 2012, AJ, 144, 159 [NASA ADS] [CrossRef] [Google Scholar]
- Ménard, B., Wild, V., Nestor, D., et al. 2011, MNRAS, 417, 801 [CrossRef] [Google Scholar]
- Murray, N., Ménard, B., & Thompson, T. A. 2011, ApJ, 735, 66 [NASA ADS] [CrossRef] [Google Scholar]
- Nelson, D., Pillepich, A., Springel, V., et al. 2019, MNRAS, 490, 3234 [Google Scholar]
- Nestor, D. B., Turnshek, D. A., Rao, S. M., & Quider, A. M. 2007, ApJ, 658, 185 [NASA ADS] [CrossRef] [Google Scholar]
- Nestor, D. B., Johnson, B. D., Wild, V., et al. 2011, MNRAS, 412, 1559 [NASA ADS] [CrossRef] [Google Scholar]
- Nielsen, N. M., Churchill, C. W., & Kacprzak, G. G. 2013, ApJ, 776, 115 [NASA ADS] [CrossRef] [Google Scholar]
- Noterdaeme, P., Srianand, R., & Mohan, V. 2010, MNRAS, 403, 906 [NASA ADS] [CrossRef] [Google Scholar]
- Noterdaeme, P., Petitjean, P., Pâris, I., et al. 2014, A&A, 566, A24 [NASA ADS] [CrossRef] [EDP Sciences] [Google Scholar]
- Oppenheimer, B. D., & Davé, R. 2006, MNRAS, 373, 1265 [NASA ADS] [CrossRef] [Google Scholar]
- Péroux, C., Rahmani, H., Quiret, S., et al. 2017, MNRAS, 464, 2053 [CrossRef] [Google Scholar]
- Péroux, C., Nelson, D., van de Voort, F., et al. 2020, MNRAS, 499, 2462 [CrossRef] [Google Scholar]
- Perrotta, S., Coil, A. L., Rupke, D. S. N., et al. 2024, ArXiv e-prints [arXiv:2409.10013] [Google Scholar]
- Popesso, P., Concas, A., Cresci, G., et al. 2023, MNRAS, 519, 1526 [Google Scholar]
- Rao, S. M., Turnshek, D. A., & Nestor, D. B. 2006, ApJ, 636, 610 [Google Scholar]
- Rubin, K. H. R., Prochaska, J. X., Koo, D. C., Phillips, A. C., & Weiner, B. J. 2010, ApJ, 712, 574 [NASA ADS] [CrossRef] [Google Scholar]
- Rubin, K. H. R., Diamond-Stanic, A. M., Coil, A. L., Crighton, N. H. M., & Moustakas, J. 2018, ApJ, 853, 95 [NASA ADS] [CrossRef] [Google Scholar]
- Rubin, K. H. R., Juarez, C., Cooksey, K. L., et al. 2022, ApJ, 936, 171 [NASA ADS] [CrossRef] [Google Scholar]
- Rupke, D. S. N., Coil, A., Geach, J. E., et al. 2019, Nature, 574, 643 [NASA ADS] [CrossRef] [Google Scholar]
- Schmidt, K. 2021, https://doi.org/10.5281/zenodo.5131705 [Google Scholar]
- Schroetter, I., Bouché, N. F., Zabl, J., et al. 2019, MNRAS, 490, 4368 [CrossRef] [Google Scholar]
- Srianand, R. 1996, ApJ, 462, 643 [NASA ADS] [CrossRef] [Google Scholar]
- Steidel, C. C., Erb, D. K., Shapley, A. E., et al. 2010, ApJ, 717, 289 [Google Scholar]
- Storn, R., & Price, K. 1997, J. Global Optim., 11, 341 [Google Scholar]
- Straka, L. A., Whichard, Z. L., Kulkarni, V. P., et al. 2013, MNRAS, 436, 3200 [Google Scholar]
- Suresh, J., Nelson, D., Genel, S., Rubin, K. H. R., & Hernquist, L. 2019, MNRAS, 483, 4040 [NASA ADS] [CrossRef] [Google Scholar]
- Tremonti, C. A., Heckman, T. M., Kauffmann, G., et al. 2004, ApJ, 613, 898 [Google Scholar]
- Tumlinson, J., Peeples, M. S., & Werk, J. K. 2017, ARA&A, 55, 389 [Google Scholar]
- van der Wel, A., Franx, M., van Dokkum, P. G., et al. 2014, ApJ, 788, 28 [Google Scholar]
- Veilleux, S., Cecil, G., & Bland-Hawthorn, J. 2005, ARA&A, 43, 769 [NASA ADS] [CrossRef] [Google Scholar]
- Welty, D. E., Frisch, P. C., Sonneborn, G., & York, D. G. 1999, ApJ, 512, 636 [NASA ADS] [CrossRef] [Google Scholar]
- Weng, S., Péroux, C., Karki, A., et al. 2023, MNRAS, 523, 676 [NASA ADS] [CrossRef] [Google Scholar]
- Weng, S., Péroux, C., Ramesh, R., et al. 2024, MNRAS, 527, 3494 [Google Scholar]
- Wuyts, S., Franx, M., Cox, T. J., et al. 2009, ApJ, 696, 348 [Google Scholar]
- York, D. G., Khare, P., Vanden Berk, D., et al. 2006, MNRAS, 367, 945 [NASA ADS] [CrossRef] [Google Scholar]
- Zabl, J., Bouché, N. F., Schroetter, I., et al. 2019, MNRAS, 485, 1961 [NASA ADS] [CrossRef] [Google Scholar]
- Zabl, J., Bouché, N. F., Wisotzki, L., et al. 2021, MNRAS, 507, 4294 [NASA ADS] [CrossRef] [Google Scholar]
- Zibetti, S., Ménard, B., Nestor, D. B., et al. 2007, ApJ, 658, 161 [NASA ADS] [CrossRef] [Google Scholar]
All Tables
All Figures
|
Fig. 1. Host galaxies associated with the ultra-strong Mg II absorbers. The postage stamp HSC color composite images centered on the quasar are depicted with gray contours. The SDSS fiber, with a radius of 1.5″, is indicated by dashed circles, while the cyan-colored aperture highlights the USMgII host galaxy. The first three rows exhibit an example set of potential host detections at close quasar proximity for USMgII systems with direct [O II] detection (at the 2σ level) followed by [O II] detections at the < 2σ level in rows 4−7. The bottom two rows display cases with no detection around the quasar. Additionally, the right panels showcase the stacked [O II] emission line profiles, and the gray curve shows the associated error. |
| In the text | |
|
Fig. 2. Best-fit SED of host galaxies associated with USMgII absorbers. The postage stamp HSC color composite images, centered on the quasar, are depicted with gray contours. The SDSS fiber, with a radius of 1.5″, is indicated by a dashed yellow circle, while the cyan-colored aperture highlights the USMgII host galaxy. The second column exhibits the corresponding multiband best-fit SED model at the absorber redshift. |
| In the text | |
|
Fig. 3. Distribution of the detection rate of USMgII absorber galaxies with redshift. The square shows the average r-band magnitude of galaxies per redshift bin, along with the 16th and 84th percentiles. |
| In the text | |
|
Fig. 4. A potential galaxy candidate from the faint end population at zabs = 1.018, along J234451.70+000603.2 quasar sight line at zqso = 2.4. Left panel: The postage stamp HSC multiband images after quasar removal. Top right panel: HSC five band median co-added image showing a potential host galaxy detected at 2.7σ level, marked as cyan aperture. The SDSS fiber, with a radius of 1.5″, is indicated by a dashed circle whereas the quasar is shown as contours. Bottom right panel: An emission signature at the expected [O II] λλ3727, 3729 wavelength, detected at ∼3.2σ level. |
| In the text | |
|
Fig. 5. Main sequence, SFR versus stellar mass, USMgII absorber host galaxies. The dashed-blue and solid-red lines depict the best linear fit for main sequence galaxies at 0.5 ≤ z < 1 and 1 ≤ z < 2, respectively while the solid-green line represents the sequence for starburst galaxies from Bisigello et al. (2018). The symbols are color-coded with the redshift. The shaded and hatched regions indicate the 1σ confidence interval. Additionally, the dotted-line represents the SFR threshold for wind launching from Murray et al. (2011). Top panel: SFR of USMgII galaxies normalized by the main sequence star-forming galaxy at respective redshift. |
| In the text | |
|
Fig. 6. Equivalent width (W2796) versus impact parameter (ρ) relation for MgII galaxies. Bottom panel: W2796 versus ρ distribution for Mg II galaxies from literature. The best-fit anticorrelation between W2796 and ρ is shown as a solid line along, and the 16th and 84th percentiles are indicated as a hatched region. The best-fitting relationships from the literature for z ∼ 1 Mg II systems from Lundgren et al. (2021, dot-dashed line) and a global fit for 0 < z < 1.5 from Guha et al. (2024, dashed line) are also plotted for reference. Top panel: Similar to the above but for only USMgII galaxies (circle), color coded by the M⋆. The quasar-galaxy pairs classified as “wind”, with ϕ ≥ 50°, and “disk”, with ϕ ≤ 30°, are respectively represented with star and square symbols. The wind subset preferentially shows a higher W2796 and a larger scatter relative to the disk subset. |
| In the text | |
|
Fig. 7. Distribution of Mg II absorbers as a function of azimuthal angle (ϕ) for the USMgII host galaxies. Left panel: The ϕ distribution for USMgII galaxies with ellipticity e ≥ 0.2. The symbol size represents the W2796/W2600, with the color denoting the strength of the equivalent width (W2796). Right panel: Same as the left panel but for the subset with an ellipticity of e ≥ 0.3. The histogram shows the cumulative ϕ distribution of the USMgII absorber below (gray region) and above (yellow region) the median impact parameter of 11.4 kpc, respectively. |
| In the text | |
|
Fig. 8. Relative abundances, [X/Zn], along detection versus clear sight lines for several species compared with the depletion patterns of the Milky Way halo (dashed line) and warm disk (dashed-dot line) gas from Welty et al. (1999). The zero point of the ordinate corresponds to the solar metallicity. |
| In the text | |
|
Fig. 9. Excess surface density of galaxies along USMgII sight lines as a function of impact parameter with respect to a control quasar set of similar redshift and color. A clear overdensity of galaxies is evident for ρ ≲ 50 kpc. The inset shows the same for galaxies selected based on photometric redshift. |
| In the text | |
Current usage metrics show cumulative count of Article Views (full-text article views including HTML views, PDF and ePub downloads, according to the available data) and Abstracts Views on Vision4Press platform.
Data correspond to usage on the plateform after 2015. The current usage metrics is available 48-96 hours after online publication and is updated daily on week days.
Initial download of the metrics may take a while.