Fig. 8.
Download original image
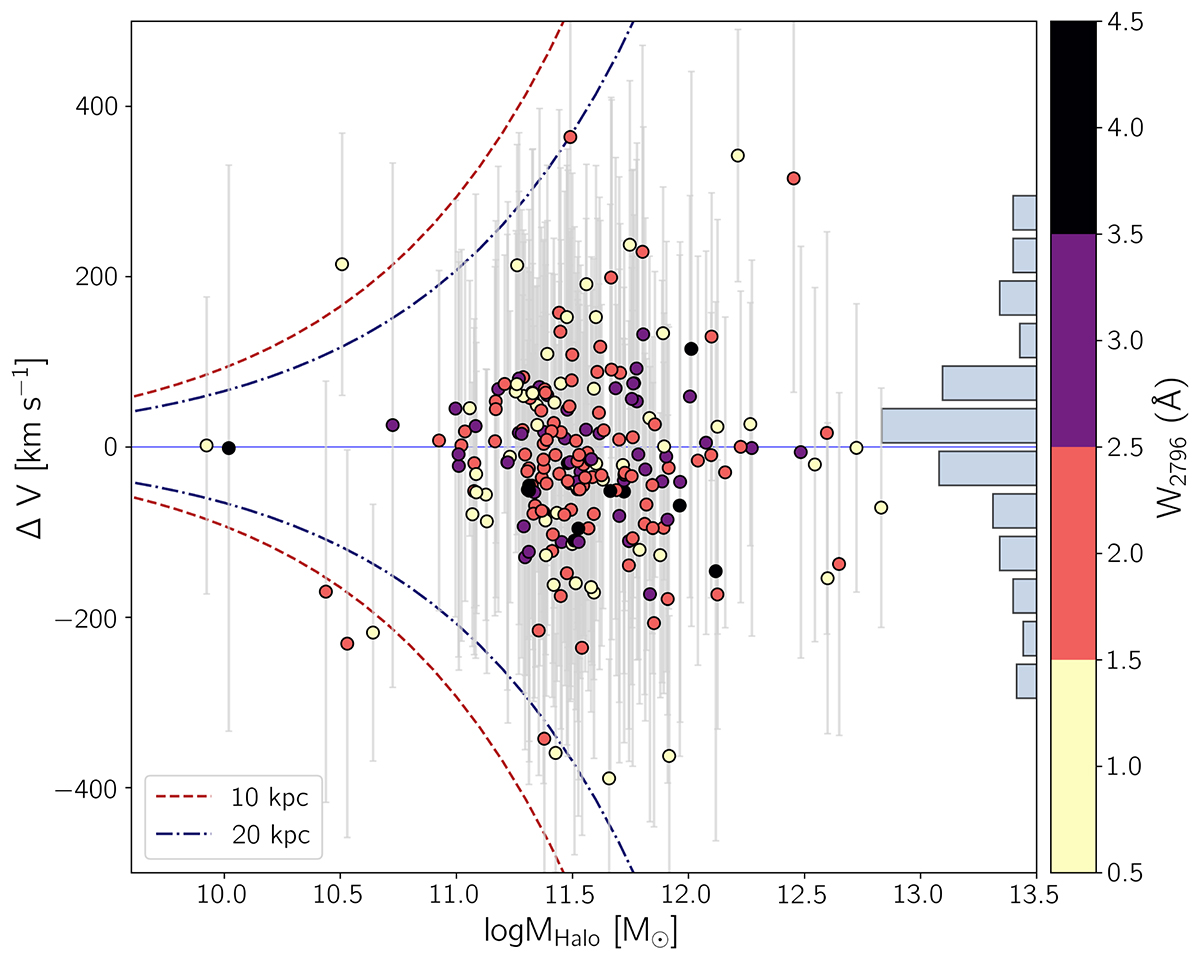
Mg II component velocity centroids with respect to the galaxies’ systemic redshift as a function of the inferred dark matter halo mass. The histogram represents the distribution of the individual component velocities. The dashed and dashed dots show the mass-dependent escape velocities at a distance corresponding to the average and the maximum impact parameters of 10 and 20 kpc, respectively, in our sample.
Current usage metrics show cumulative count of Article Views (full-text article views including HTML views, PDF and ePub downloads, according to the available data) and Abstracts Views on Vision4Press platform.
Data correspond to usage on the plateform after 2015. The current usage metrics is available 48-96 hours after online publication and is updated daily on week days.
Initial download of the metrics may take a while.