| Issue |
A&A
Volume 695, March 2025
|
|
|---|---|---|
| Article Number | A198 | |
| Number of page(s) | 16 | |
| Section | Stellar atmospheres | |
| DOI | https://doi.org/10.1051/0004-6361/202452491 | |
| Published online | 21 March 2025 | |
X-Shooting ULLYSES: Massive stars at low metallicity
XI. Pipeline-determined physical properties of Magellanic Cloud OB stars
1
Astrophysics Research Cluster, School of Mathematical and Physical Sciences, University of Sheffield,
Hicks Building, Hounsfield Road,
Sheffield
S3 7RH,
UK
2
School of Chemical, Materials and Biological Engineering, University of Sheffield,
Sir Robert Hadfield Building, Mappin Street,
Sheffield
S1 3JD,
UK
3
Space Telescope Science Institute,
3700 San Martin Drive,
Baltimore,
MD
21218,
USA
4
Institute of Astronomy, KU Leuven,
Celestijnenlaan 200D,
3001
Leuven,
Belgium
5
Departamento de Astrofísica, Centro de Astrobiología, (CSIC-INTA),
Ctra. Torrejón a Ajalvir, km 4,
28850 Torrejón de Ardoz,
Madrid,
Spain
6
Armagh Observatory and Planetarium, College Hill,
BT61 9DG
Armagh, Northern Ireland,
UK
7
Astronomical Institute Anton Pannekoek, Amsterdam University,
Science Park 904,
1098 XH
Amsterdam,
The Netherlands
8
Astronomisches Rechen-Institut, Zentrum für Astronomie der Universität Heidelberg,
Mönchhofstr. 12–14,
69120
Heidelberg,
Germany
★ Corresponding author; This email address is being protected from spambots. You need JavaScript enabled to view it.
Received:
4
October
2024
Accepted:
25
January
2025
Abstract
Context. The proximity and low dust extinction of the Magellanic Clouds provides an ideal environment for metal-poor massive stars to be studied in detail. The Hubble Space Telescope ULLYSES initiative has provided exquisite ultraviolet spectroscopy of a large sample of OB stars in the Magellanic Clouds, and its legacy value has been enhanced through the acquisition of optical VLT/XShooter spectroscopy (XShootU).
Aims. We aim to determine the spectral types and physical properties of 122 LMC and 103 SMC OB stars observed via XShootU. Physical parameters are required for these to serve as templates in spectral libraries of metal-poor massive stars. We also aim to identify double-lined binaries and OeBe stars for which analysis requires non-standard treatment.
Methods. We have applied a pipeline designed to analyse large spectroscopic samples of hot luminous stars to XShootU spectroscopic datasets, together with grids of synthetic model spectra computed with the non-Local Thermodynamic Equilibrium atmospheric code FASTWIND at LMC and SMC metallicities.
Results. We have determined physical and wind properties of 97 LMC and 77 SMC massive stars, ranging from O2 to B9 subtypes, representing the majority of the XShootU OB sample (OeBe and candidate SB2 systems are excluded). Results are broadly in agreement with previous optical spectroscopic studies, with evolutionary masses spanning 12–117 M⊙ in the LMC and 11–74 M⊙ in the SMC. We have determined a revised Teff-spectral type calibration for Magellanic Cloud stars, identified stars with peculiar radial velocities, and compared wind properties of high luminosity O stars with dense winds, revealing ∼ 0.27 dex higher wind momenta of LMC stars with respect to SMC counterparts. Incorporating the recent empirical metallicity dependence of Z0.22 for wind velocities, this suggests a mass-loss dependence of Z0.5 for luminous O stars. Studies incorporating ultraviolet mass-loss diagnostics are required for OB stars with weak winds and/or low luminosities.
Key words: stars: atmospheres / stars: early-type / stars: massive / stars: mass-loss / stars: winds, outflows
© The Authors 2025
 Open Access article, published by EDP Sciences, under the terms of the Creative Commons Attribution License (https://creativecommons.org/licenses/by/4.0), which permits unrestricted use, distribution, and reproduction in any medium, provided the original work is properly cited.
This article is published in open access under the Subscribe to Open model. This email address is being protected from spambots. You need JavaScript enabled to view it. to support open access publication.
1 Introduction
Massive stars, in spite of their rarity, are responsible for energetic transients (Smartt 2015; Levan et al. 2016), multi-messenger astrophysics (Abbott et al. 2016) plus direct (stellar) and indirect (nebular) diagnostics in high redshift galaxies observed with James Webb Space Telescope (Arellano-Córdova et al. 2022; Cameron et al. 2023; Curti et al. 2024). Many of these phenomena are favoured at low metallicity, so there is a renewed interest in the properties and evolution of metal-poor massive stars.
Locally, the proximity of the Magellanic Clouds provides our best view of individual metal-poor massive stars, with present-day metallicities 1/2 Z⊙ (LMC) and 1/5 Z⊙ (SMC) (Russell & Dopita 1990). Extremely metal-poor massive stars have been identified in the Local Group (Garcia et al. 2019; Telford et al. 2021), but these are exceptionally rare owing to the modest star-formation rates of their host galaxies (Crowther 2019).
The rest-frame ultraviolet and optical spectroscopic appearance of young stellar populations are dominated by massive stars (≥ 8 M⊙), owing to their high bolometric luminosities. However, interpretation of observations is hindered by uncertainties in the evolution of massive stars as a result of rotational mixing, stellar winds and binarity, especially the dependence of these quantities on metallicity (Langer 2012).
Evolutionary calculations for main-sequence OB stars generally adopt theoretical mass-loss prescriptions (Vink et al. 2001) which likely underestimate rates for very massive stars (Bestenlehner et al. 2014; Bestenlehner 2020) and overestimate rates for B supergiants (Bernini-Peron et al. 2024). Rotational velocities peak at fairly modest rates, but extend to high velocities (Ramírez-Agudelo et al. 2013; Dufton et al. 2013), likely due to binary interaction (de Mink et al. 2014). The close binary fraction of massive stars is high in the Milky Way and LMC (Sana et al. 2012, 2013), with SMC results awaiting analysis of the BLOeM survey (Shenar et al. 2024).
Contemporary population synthesis models typically employ synthetic ultraviolet and optical spectra of OB stars (Bruzual & Charlot 2003; Leitherer et al. 2010; Millán-Irigoyen et al. 2021). Historically, empirical libraries of OB stars have been limited to solar metallicity (Howarth & Prinja 1989; Verro et al. 2022). Spectroscopic optical surveys such as VFTS (Evans et al. 2011) have targeted the Magellanic Clouds, but these lack absolute flux calibration, and only modest ultraviolet samples have been acquired (Walborn et al. 1995; Bouret et al. 2003; Crowther et al. 2016).
The recent Hubble Space Telescope Director's Discretionary programme ULLYSES (Roman-Duval et al. 2020) Roman-Duval et al. (in prep.) and associated VLT Large Programme XShootU (Vink et al. 2023) provide high quality UV and optical spectroscopy of OB stars in the Magellanic Clouds. This initiative permits an improved understanding of stellar winds (Backs et al. 2024) and CNO abundances (Martins et al. 2024) at different metallicities, plus template OB stars at sub-solar composition (Crowther & Castro 2024).
It is necessary to determine the physical properties of ULLYSES/XShootU stars in order to incorporate these observations into population synthesis codes. This is the primary goal of the present study, exploiting a new pipeline for the efficient analysis of large samples of optical OB spectra (Bestenlehner et al. 2024), and is intended to complement detailed studies of more limited sub-samples (e.g. Bernini-Peron et al. 2024; Backs et al. 2024). Physical parameters of Magellanic Cloud OB stars are also useful in the context of the Sloan Digital Sky Survey V (SDS-SV) Local Volume Mapper which is characterizing nebular emission in the Magellanic Clouds and southern Milky Way (Drory et al. 2024).
We present observational datasets in Section 2, including contemporary spectral classification of XShootU targets, briefly describe the pipeline used to analyse ULLYSES OB stars in Section 3. We present our derived physical parameters in Section 4, allowing us to compare the properties of XShootU OB stars between the Magellanic Clouds. The inclusion of Hα allows wind properties of stars with dense winds to be quantified in Section 5, incorporating wind velocities courtesy of ULLYSES spectroscopy (e.g. Hawcroft et al. 2024), so extends the previous empirical study of Mokiem et al. (2007b). Finally, comparisons with literature results are made in Section 6 and brief conclusions are drawn in Section 7.
2 Spectroscopic datasets and classification
2.1 Optical spectroscopy
Our primary datasets are VLT/Xshooter spectroscopy obtained with the ESO Large Programme XShootU (Vink et al. 2023), which provides complete spectral coverage of 114 LMC and 112 SMC stars between Oct 2020 and Jan 2022. Spectral coverage involved 3100–5500 Å (UBV arm), 5500–10 200 Å (VIS arm) at resolving powers of R = 6700 (45 km s−1) and 11 400 (26 km s−1), respectively, using the 0.8 and 0.7 arcsec slits. Version 2 of the early data release (eDR2) was used for our spectroscopic analysis. Full details of the bespoke data reduction process are provided in Sana et al. (2024), including slit-loss correction, co-addition, flux calibration, telluric correction and normalisation. Sky regions were adjusted to ensure nearby companions were excluded from background regions.
The ULLYSES Magellanic Cloud target selection is described in Roman-Duval et al. (in prep.). In brief, representative OB stars in both Clouds have been identified spanning spectral type and luminosity class ( O and early B), plus a modest selection of B supergiants at all spectral types. Targets have been selected on the basis of literature (heterogeneous) classifications, with an attempt made to exclude known binaries, with a few notable exceptions (e.g. HD 5980, LMC X-4).
Consequently, in contrast to other large spectroscopic surveys of the OB stars in the Magellanic Clouds, such as VFTS (Evans et al. 2011) or BLOeM (Shenar et al. 2024), ULLYSES/XShootU is not intended to provide a representative subset of massive stars in the LMC or SMC. Targets were selected to minimise binarity, and preferentially select UV bright targets along low extinction sight-lines.
Nevertheless, several examples of spectroscopic or eclipsing binaries were known from the pre-XShootU literature (Vink et al. 2023). The majority of XShootU targets were observed via two back-to-back exposures, but multiple observations of selected targets were obtained (Sana et al. 2024, see their Appendix C) which permit (a subset of) close binary systems to be identified. XShootU omitted several ULLYSES targets for which archival VLT/Xshooter spectroscopy was available. These are excluded from our spectroscopic analysis since the tailored data reduction process of Sana et al. (2024) was not followed.
In addition, supplementary observations of selected narrowlined ULLYSES stars ( 21 in LMC, 27 in SMC) have been obtained with the Magellan 6.5 m Clay dual-echelle spectrograph MIKE between Dec 2021 and Dec 2022, which provides spectral coverage from 3350–5000 Å (blue arm) and 4900–9500 Å (red arm) at resolving powers of R = 35 000 and 40 000 (∼ 8 km s−1), respectively, using the 0.7 arcsec slit. A standard echelle data reduction process was followed. Examples of representative spectra are presented in Fig. 9 of Crowther (2022).
The Magellan/MIKE dataset was not used for the spectroscopic pipeline, but its higher resolution with respect to VLT/Xshooter greatly helped to identify double-lined binaries. By way of example, BI272 was classified as O7 II by Conti et al. (1986), with O9 II favoured from inspection of XShootU datasets, despite unusually strong Si III λλ4553–4575 features. Close inspection of the MIKE spectrum indicated broad and narrow components in He I lines, plus broad HeI lines, indicating a O7 V primary and B2 secondary component, the latter responsible for Si III and Mg II λ4481. Brands et al. (2024) attributed their inability to obtain a satisfactory fit to BI272 to binarity.
2.2 UV spectroscopy
Although the primary goal of the present study is to determine the physical parameters of XShootU targets, we also consider wind properties in Section 5. In order to convert wind densities (largely obtained from Hα) to mass-loss rates and wind momenta, we require wind velocities, which are primarily obtained from far ultraviolet P Cygni profiles of N V λλ1238–42, Si IV λλ1393–1402 and C IV λλ1548–51.
ULLYSES1 (Roman-Duval et al. 2020) provides far-UV spectroscopy for nearly all XShootU targets, courtesy of a STScI Director's Discretionary Award using the COS or STIS instruments aboard Hubble Space Telescope. COS G130M/1291 + G160M/1611 spectroscopy achieved a wavelength coverage of λλ1132–1433 Å at R = 14 000, while STIS E140M spectroscopy achieve a wavelength coverage of λλ1143–1710 Å at R = 46 000. Further details of ULLYSES are provided by Roman-Duval et al. (in prep.). Four targets initially selected for observation were ultimately dropped from the ULLYSES programme, namely AzV 255 (SMC), Sk −67∘ 51 (LMC), BI 128 (LMC) and [ST92] 5-52 (LMC), though were retained for XShootU.
Wind velocities for a subset of the XShootU sample have previously been determined by Sobolev with Exact Integral (SEI) fitting (Hawcroft et al. 2024). For the remainder, we accessed DR7 datasets from ULLYSES in order to either fit (SEI method) or directly measure wind velocities, following the method set out by Prinja et al. (1990), Prinja & Crowther (1998) and Crowther et al. (2016).
2.3 Classification
We have established LMC and SMC reference OB stars from comparison with Galactic O star templates from Maíz Apellániz et al. (2016) and Galactic B star templates from Negueruela et al. (2024). These stars are drawn from the present datasets, supplemented by archival VLT/FLAMES (Evans et al. 2006; Dufton et al. 2019) and BLOeM (Shenar et al. 2024) datasets. Reference stars are ideally sharp-lined, permitting rotational broadening to be applied for comparison with fast rotators.
Montages of XShootU spectroscopy of OB dwarfs, giants and supergiants for each galaxy are available in Figures B.1–B. 8 (see Sect. 7). Owing to the absence of SMC B5 and B9 supergiants amongst the XShootU sample, we have included spectroscopy of these subtypes from the BLOeM survey (Shenar et al. 2024) which have been classified using an identical approach.
2.3.1 O stars
Spectral types of O stars generally involved the relative strengths of He II λ4541 to He I λ4471, or He I λ4388, following Sota et al. (2011) and Maíz Apellániz et al. (2016). For very early O-type stars we used the scheme of Walborn et al. (2002b), which is based on N III λλ4634–41 and N IV λ4058 diagnostics. In general one would expect extremely weak He I signatures for such stars, but He I is relatively strong in a few instances (AzV 14, AzV 435, W61 28-5), which is suggestive of binarity.
Luminosity classes generally follow the morphology of He II λ4686 following Walborn (1971, 1972), updated for O8.5–9.7 subtypes by Sota et al. (2011) which uses the ratio of He II λ4686 to е I λ4713.
2.3.2 B stars
For B0–0.7 subtypes, our primary diagnostic is the ratio of Si IV λ4088 to Si III λ4553 (Negueruela et al. 2024). This is metallicity dependent (Walborn 1983), so the high quality of XShootU datasets permitted the use of helium diagnostics too (Sota et al. 2011). In Fig. 1 we present line ratios of He and Si diagnostics for O4 to early B stars (upper panel) highlighting primary ratios for different spectral types. In practice, classifications based on Si or He are in close agreement. For example, the B0 Ia standard Sk −68∘ 52 from Fitzpatrick (1991) remains as B0 Ia from both Si and He diagnostics, while his B0.5 Ia standard Sk −68∘ 41 is reclassified as B0.7 Ia from both diagnostics.
Spectral types of LMC B1+ supergiants are based on Galactic templates adapted from Fitzpatrick (1991) to ensure consistency in Si II–IV line strengths with Galactic standards of Negueruela et al. (2024), together with Mg II λ4481 to He I λ4471 for B5+ stars, as shown in the lower panel of Fig. 1. The B1.5 Ia standard Sk −67∘ 14 from Fitzpatrick (1991) has been reclassified B1 Ia from the ratio of Si IV λ4088 to Si III λ4553, while his B3 Ia standard Sk −67∘ 78 remained unchanged.
The high quality of XShootU observations could permit the addition of a new B4 Ia LMC standard (Sk −70∘ 50), on the basis of the ratio of Si III λ4553 to SiII λ4128 and i III λ4553 to Mg II λ4481. Nevertheless, we retain B3 Ia (Fitzpatrick 1991) following the discussion relating to the B4 subtype by Negueruela et al. (2024).
For SMC B1+ supergiants we have largely followed the scheme of Lennon (1997) owing to the weakness of metallic lines. Figure 1 demonstrates that the Si III λ4553 to Mg II λ4481 is a robust discriminator of B2–3 supergiants. Classification of late B supergiants qualitatively follows the LMC scheme, except that no B7 subtypes are defined for the SMC. The high quality of our XShootU datasets has lead to reclassification of several B supergiants with respect to Lennon (1997), including AzV 96 (B1.5 to B1 since Si IV λ4116 is clearly detected), AzV 22 (B5 to B3 since Si III λ4553 is clearly detected). B-type luminosity classes in both galaxies were assigned from comparison with Hγ morphologies of contemporary Galactic templates (Negueruela et al. 2024).
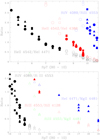 |
Fig. 1 Overview of He and metal classification diagnostics for Galactic OB stars. Symbols are circles for luminosity classes V–IV, squares for III–II and triangles for I, filled for primary diagnostics, open for secondary diagnostics. Upper panel: Overview of He I–II and Si III–IV classification diagnostics for O and early B templates (Sota et al. 2011; Negueruela et al. 2024). Lower panel: As above, for Si II–IV and He I/Mg II classification diagnostics for B stars (restricted to supergiants for B2.5+), excluding B4, B6 subtypes for LMC stars (Fitzpatrick 1991). We also show the ratio of Si III λ4553 to Mg II λ4481 for B2–3 supergiants (green) since this is the qualitative diagnostic for SMC mid-B supergiants with B4, B6–7 excluded (Lennon 1997). |
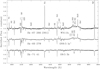 |
Fig. 2 Sequence of late O supergiant (Sk −71∘ 41, 09.5 Ib, this study), late O hypergiant (Sk −69∘ 279, ON9.5 Ia+, this study) and very late WN star (Sk −67∘ 266, WN11h, Crowther & Smith 1997) in the LMC, illustrating the transition from absorption line dominated stars to emission line dominated (e.g. He I λ4471, He II λ4686). Note that Balmer lines include nebular contributions for Sk −67∘ 266 (S61). |
2.3.3 OBC/OB/OBN classifications
Regarding OC/O/ON and BC/B/BN nomenclature, we have followed past convention (Walborn & Fitzpatrick 1990) in assigning ON for unusually strong N V λλ4603–20 absorption for early O stars (e.g. VFTS 506), unusually strong N III λ4520 for late O stars (e.g. Sk −68∘ 135). AzV 215 was reclassified from BN0 Ia (Lennon 1997) to B0 Ia since its nitrogen lines are comparable in strength to normal B0 supergiants (e.g. AzV 235). Conversely, we assigned OC to early (e.g. Sk −68∘ 133) and mid (e.g. AzV 69) O stars for which C III λλ4647–51 emission exceeded N III 14634, and early B stars for which N II λ4447 and λλ4601–43 were unusually weak (e.g. Sk −68∘ 26).
2.3.4 OB hypergiants versus Wolf-Rayet stars
The emphasis of the present study is the analysis of OB stars, with Wolf-Rayet stars excluded owing to our grid selection. Classification diagnostics for O2–4 stars versus WN5–7 stars includes Hβ (Crowther & Walborn 2011), while late O stars are discriminated from WN9–11 stars on the basis of He II 14686 and He I λ5876 (or λ4471) emission (Crowther & Smith 1997).
By way of example, Sk −68∘ 135 is a late O hypergiant (ON9.7 Ia+, Walborn 1977) despite strong Hβ emission. Sk −69∘ 279 has previously been classified as O9.2 Iaf (Gvaramadze et al. 2018) but is reclassified as a late O hypergiant (ON9.5 Ia+) owing to its morphological similarity to Sk −68∘ 135, despite even stronger Hβ emission. Figure 2 compares blue VLT/Xshooter spectra of Sk −69∘ 279 to a normal late O supergiant (Sk −71∘ 41), and a very late WN star (Sk −67∘ 266, S 61) showing the transition from absorption line dominated to emission line dominated stars.
2.4 XShootU sample
Fig. 3 provides a histogram of spectral types and luminosity classes of LMC and SMC ULLYSES OB stars, based on XShootU spectral classifications, including several stars with archival VLT/Xshooter datasets. As noted above, ULLYSES targets were selected to provide complete coverage of spectral type and luminosity class for O and early B stars in both Clouds, plus full spectral type coverage of B supergiants. In reality, early O stars are exceptionally rare in the SMC plus some historical classifications required adjustment, such that all SMC ULLYSES targets later than B3 are B8 supergiants. In addition, several literature late O or early B dwarfs were newly classified as giants or binaries or both (e.g. N206-FS 170, B1 III: + B). This is not wholly unexpected since HST orbit requirements were biased towards far-UV bright targets (Roman-Duval et al., in prep.).
For the current spectroscopic analysis all observations were coadded. Since we excluded SB2's from our sample this should not impact our analysis. We have also excluded LMC X-4 (SB1) for which spectral variability was identified (our classification is based on the first epoch of observation). Wolf–Rayet stars were excluded from the analysis, together with OB stars whose spectra include problematic features for the pipeline (e.g. strong nebulosity). Several OeBe stars were also identified and excluded from analysis. Hα profiles of OeBe stars are shown in Fig. 4. Spectral types of excluded stars are provided in Tables A.3–A.4. Literature results for the majority of these are provided in Vink et al. (2023).
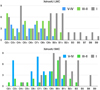 |
Fig. 3 Spectral types and luminosity classes of LMC (upper panel) and SMC (lower panel) ULLYSES OB stars based on XShootU spectral classifications, including archival VLT/Xshooter stars (blue: V–IV, green III–II, grey: I). |
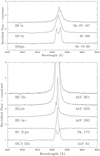 |
Fig. 4 Hα profiles of OeBe stars in the SMC (lower panel) and LMC (upper panel), excluded from our pipeline analysis. |
3 Pipeline
For our spectroscopic analysis pipeline we employed grids of synthetic model spectra computed with v10.6 of the non-Local Thermodynamic Equilibrium atmosphere code FASTWIND (Puls et al. 2005; Rivero González et al. 2012) including H, He, C, N, O, Si and Mg as explicit elements. Separate grids were calculated for LMC and SMC metallicities, assuming 0.5 Z⊙ and 0.2 Z⊙ respectively with initial, semi-processed and fully processed CNO composition. Grids covered the following parameter space log Teff (K) over [4.0, 4.775] in 0.025 dex steps, corresponding to 10 kK ≤ Teff ≤ 60 kK, log g(cm s−2) over [1.5, 4.5] in 0.2 dex steps, wind strength log Q over [−11.4, −15.0] in 0.3 dex steps and Helium abundances in mass-fraction Y over [0.15, 0.55] in 0.05 steps. Convergence difficulties were experienced at the lowest temperatures (Teff ≤ 12 kK) impacting on fits to B 9 supergiants.
The wind–strength parameter Q = Ṁ(R* v∞)−3/2, with units M⊙ yr−1, R⊙ and km s−1, so mass-loss rates can be determined from Q, R* and v∞. In addition, we varied nitrogen abundances for high temperature grids from log Teff/K = 4.6 to 4.775, ranging from initial N-abundance (Vink et al. 2023) to fully CNO processed (4 values for LMC, 3 values for SMC) as the ionisation balance between nitrogen ions becomes the main temperature diagnostic.
A smooth wind with volume filling factor fv = 1 and β = 1 velocity law was assumed and micro-turbulent velocity was set to vmic = 10 km s−1. For the terminal wind velocities, v∞, in our grid we adopted the empirical calibration of Magellanic Cloud OB stars by Hawcroft et al. (2024), namely
![Mathematical equation: $\left.v_{\infty}=\left[(92 \pm 3) T_{\mathrm{eff}} / \mathrm{kK}\right)-(1040 \pm 100)\right] Z / Z_{\odot}^{(0.22 \pm 0.03)}$](/articles/aa/full_html/2025/03/aa52491-24/aa52491-24-eq1.png) (1)
(1)
in km s−1 for LMC (Teff ≥ 15 kK, Z = 0.5 Z⊙) and SMC (Teff ≥ 20 kK, Z = 0.2 Z⊙) OB stars. These results involved Sobolev with Exact Integral (SEI) fits to ULLYSES (Roman-Duval et al. 2020) observations supplemented with literature results, and was extrapolated to lower temperature with a minimum v∞ = 250 km s−1. Individual wind velocities were used when determining mass-loss rates from wind densities, Q, as discussed in Section 5.1.
A complete description of the pipeline2 is provided in Bestenlehner et al. (2024). In brief, we used the spectral range λλ3800–7200 Å including the observational error spectrum (Sana et al. 2024) by utilising a χ2 minimisation Ansatz:
 (2)
(2)
with d the observed and s the synthetic spectra, R the instrumental responds matrix and observational, diagonal error matrix N. As model uncertainties should be budgeted into the parameter determination we de-idealised the model spectrum s according to Bestenlehner et al. (2024).
Our sample is fairly heterogeneous, ranging from early O dwarfs to late B supergiants, and extends to Of/WN stars, though excludes WR stars, which are outside the intended parameter space of FASTWIND. Therefore, the model-error has been averaged over the entire parameter space of our sample. This impacted the overall performance of the pipeline. For example, targets with stronger winds (log Q > −12.5) were affected by stellar wind assumptions, which would be included into the model-error. However, weak-wind targets would not provide any information on the accuracy of the wind assumptions made in the stellar atmosphere model and potentially average out those contributions. Therefore, a meaningful model-error should be ideally based on a sample of similar objects (c.f. the discussion in Bestenlehner et al. 2024).
Typical macro-turbulent velocities for OB stars are in the range between a few km s−1 to ∼ 30 km s−1. The velocity resolution of the UBV and VIS arm are 45 and 26 km s−1, respectively (Section 2.1). Therefore, we convolved our synthetic grid with a fixed vmac = 20 km s−1 and assumed any additional broadening is due to rotation, with projected rotational velocities of ve sin i = [0, 10, 20, 35, 50, 75, 100, 150, 200, 250, 300, 350, 400, 450, 500] km s−1.
Observations were cross-correlated with synthetic template spectra to determine their radial velocity (RV) and then corrected for the RV shift before sampled on the wavelength grid of the synthetic spectra. Figure 5 shows a bimodal distribution of RVs corresponding to the LMC and SMC, with average values of vrad = 290 ± 46 km s−1, and vrad = 166 ± 33 km s−1, respectively. Outliers are potential multiple systems or runaway stars, and include Sk −67∘ 22 (LMC) with vrad = 468 km s−1 and NGC 346 ELS 26 (SMC) with 227 km s−1.
Hydrogen lines are the most prominent lines in OB stars and dominate the χ2. As our sample includes O and B stars, He lines can be as weak as metal lines. Therefore, we chose the following wavelength sampling: First, we initialize a wavelength array with 0.1 Å spacing around the spectral lines in our FASTWIND LINES-list. Second, we increased the number of wavelength points by a factor of 5 beyond ± 5 Å of the central wavelength of the Balmer lines, because log g is based on the pressure-broadened wings. Third, we increased the number of wavelength points by a factor of 25 within ± 1 Å of the central wavelength of the He and metal lines.
The stellar atmosphere grid is none-rectilinear as a subset of models did not converge or failed to compute due to unphysical parameter space (e.g. Eddington limit). Before determining the uncertainties we filled the gaps in the probability distribution function (PDF) with zero-values, so that the PDF became a 4D −Teff − log g − log Q − Y rectilinear grid. The 4D grid was then interpolated to artificially increase the grid resolution using the multidimensional interpolation function scipy.interpolate.interpn with cubic-spline method to obtain more accurate parameters and less gridded uncertainties.
We used the following standard deviations in 4D; 1σ: 0.0902, 2σ: 0.5940 and 3σ: 0.9389, following Wang et al. (2015). CNO abundances and ve sin i were not included as they mainly improve the fit to the nitrogen lines and the line broadening, but also a 6D grid interpolation becomes computationally very expensive. We estimated N-abundances in the 2D−Teff − N PDF for stars hotter than log Teff/K ≥ 4.6, because the ionisation balance of the nitrogen lines became the main temperature diagnostic, and projected rotational velocities in 1D-PDF, because line broadening is largely independent of the stellar parameters.
In order to determine bolometric luminosities we adopted distance moduli of 18.48 mag (Pietrzyński et al. 2019) and 18.98 mag (Graczyk et al. 2020) for the LMC and SMC, respectively, and incorporated optical and IR photometry listed in Vink et al. (2023).
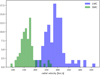 |
Fig. 5 Histogram of radial velocities (in km s−1) of LMC (blue) and SMC (green) OB stars, from cross-correlation with synthetic template spectra. |
4 Physical properties of Magellanic Cloud OB stars
Online material (see Sect. 7) includes spectral fits for each star while Table A.1 provides pipeline physical parameters, notes for which include details of problematic cases. No selected stars were excluded from our pipeline study, though parameters considered unreliable have been flagged with parentheses. Parameters were not determined for ULLYSES targets with archival VLT/Xshooter spectroscopy since they were not processed using the XShootU pipeline (Sana et al. 2024). These targets were included for completeness, since revised spectral classifications have been provided. Wind properties are discussed in Sect. 5, with parameters also provided in Table A.2. Double-lined binaries (SB2), OeBe stars and Wolf–Rayet stars were excluded from our analysis, and have been listed in Tables A.3–A.4.
Uncertainties presented here exclude systematic differences between different codes and approaches set out in Sander et al. (2024). Current results for stars in common with Sander et al. (2024, models F4) are updated in some instances. Comparisons with previous studies for a subset of our sample are deferred to Section 6.
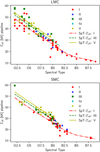 |
Fig. 6 Pipeline temperatures (kK) versus XShootU spectral types for single + SB1 stars in the LMC (upper panel) and SMC (lower panel), colour coded by luminosity class: V (yellow pentagon), IV (cyan diamond), III (green square), II (blue triangle), I (red circle). We also include our calibration for dwarfs (solid yellow line), giants (dashed green line) and supergiants (dot-dashed red line). |
4.1 Stellar temperatures
Figure 6 compares spectral types to inferred effective temperatures for our sample. We have obtained satisfactory temperatures from early to mid O stars through mid to late B stars (comparison with literature results are provided in Section 6). However the analysis is highly sensitive to the accuracy of the spectral normalisation process. For example, at the high temperature range of early O stars (Teff ≳ 50 kK) we observed a large scatter for the LMC stars. In general, the region between the N V doublet (λλ4604–4620) and He II λ4686 is poorly normalised, which results in a lower weight for this wavelength range when minimising the χ2.
Spectral type-Teff (kK) calibration of OB stars in the XShootU sample together with previous results for OB stars in the LMC (Doran et al. 2013) and SMC (Dufton et al. 2019).
For early O stars the derived temperature has been based on the ionisation balance of N IV to N V. The fairly weak line strength and the lower weight around N V implies that the presence of N V hardly contributes to the overall χ2. Other outliers included late O hypergiants in the LMC (e.g. Fig. 2) whose weak He II λ4686 were not reproduced, plus the B0.7 bright giant AzV 85 for which an unrealistically low temperature and low gravity has been obtained.
Table 1 presents the temperature scale of Magellanic Cloud OB stars inferred from this analysis, separated into classes V, III and I, together with previous calibrations for the LMC (Doran et al. 2013) and SMC (Dufton et al. 2019). These are overlaid on individual results in Fig. 6. We do not attempt to provide separate LMC and SMC scales since pipeline results for early O stars are problematic. Note that previous calibrations usually originate from multiple studies of O and B stars, whereas the present study encompasses the full range of stars from early O to late B. Temperatures obtained are broadly consistent with previous calibrations, noting the modest number of late B supergiants included in ULLYSES/XShootU.
4.2 Stellar luminosities
Figure 7 presents pipeline results in a Hertzsprung-Russell (HR) diagram (LMC: blue, SMC: green), superimposed upon LMC metallicity evolutionary tracks from Brott et al. (2011) and Köhler et al. (2015). This represents a more robust HR diagram than that presented in Vink et al. (2023) since it was based, in part, on spectral type calibrations.
Stellar luminosities plus individual reddening parameters R5495 and E(4405–5495) were obtained by fitting the photometric fluxes with the model spectral energy distribution (SED) employing the reddening law of Maíz Apellániz et al. (2014). Online material includes SED fits for each star.
A histogram of interstellar extinctions is presented in Fig. 8 for LMC (blue) and SMC (green) OB stars. Unsurprisingly for a UV-selected sample, extinctions are low, with E(B – V) ≤ 0.25 mag for the majority of sources.
From inspection of photometry-SED fits we noticed a few inconsistencies. The J-Band photometry of Sk −67∘ 2 and Sk –68∘ 8 and the K-band of N11 ELS 32 do not follow the general trend of the other photometry and the flux calibrated XShootU spectrum. These were removed from the fit. AzV 85 requires a negative E(B–V) to reproduce its SED, even though the trend of the flux calibrated spectrum and photometric points agree. In the case of AzV 6 the optical photometry was inconsistent with the flux calibrated spectrum and the near-IR photometry was offset with respect to the optical data and flux calibrated spectra. This led to an unphysically high luminosity and poor SED fit.
While ULLYSES was designed to include representative OB stars from both galaxies, the relatively modest star formation rate of the SMC resulted in a deficiency of (luminous) early O stars. This is evident in Fig. 3, and results in lower average luminosities. The mean luminosity among the O-star sample is log L/L⊙ = 5.74 ± 0.31 (LMC) versus 5.40 ± 0.40 (SMC), excluding AzV 6 (see above). For B stars log L/L⊙ = 5.40 ± 0.31 (LMC) versus 5.14 ± 0.35 (SMC). Too few Magellanic Cloud late B supergiants are included in the XShootU dataset to contribute to the Flux-weighted Gravity-Luminosity Relationship (FGLR, Urbaneja et al. 2017).
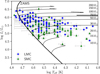 |
Fig. 7 Hertzsprung-Russell diagram of XshootU sample (LMC: blue circles, SMC: green triangles), together with LMC evolutionary tracks for 10–200 M⊙ main-sequence stars from Brott et al. (2011) and Köhler et al. (2015). Evolutionary masses of post-main sequence stars are determined from TAMS luminosities of SMC tracks from Schootemeijer et al. (2019). |
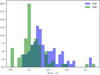 |
Fig. 8 Histogram of E(B – V) values for LMC (blue) and SMC (green) OB stars. |
4.3 Stellar masses
4.3.1 Evolutionary masses and ages
Evolutionary masses, Mevol, presented in Table A.2 were obtained from contemporary evolutionary models. For main sequence (MS) stars we used BONNSAI3 (Schneider et al. 2014), coupled to evolutionary models from Brott et al. (2011) for 5–60 M⊙ at LMC and SMC metallicity plus Köhler et al. (2015) for 60–500 M⊙ at LMC metallicity.
Evolutionary masses used spectroscopic temperatures, luminosities and ve sin i as input observables. The only prior adopted was a Salpeter Initial Mass Function, with a uniform prior for initial rotational velocity. In a few instances no solution was possible for these parameters, in which case ve sin i was excluded (solution shown with “:” in Table A.2). It was necessary to resort to the LMC grid (upper limit 500 M⊙, Köhler et al. 2015) for a small subset of SMC stars close to, or above, 60 M⊙ (e.g. AzV 232, O7 Iaf+). The use of higher metallicity models will overestimate their MS mass-loss, and in turn, overestimate their initial masses.
Initial masses are very close to current evolutionary masses, with the exception of very massive stars (e.g. VFTS 482), initially fast rotators (e.g. VFTS 72), and luminous early-type B supergiants, although these are sensitive to adopted mass-loss prescriptions (Vink et al. 2001). In a few instances current masses exceed initial masses using BONNSAI. This is because values cited are mode quantities, and occasionally current mass distributions differ from bell functions e.g. mean, median and mode Mevol for 2dFS 3694 (B0.7 III) are  and
and  , respectively.
Brott et al. (2011) models incorporated into BONNSAI only extend to the terminal age main sequence (TAMS). For postmain sequence (post-MS) stars, the determination of masses was more problematic since evolutionary models exhibited considerably more variety than during the main sequence. The luminosity at the end of the contraction phase following the TAMS provided a credible mass estimate. TAMS masses were be approximated by initial masses (at most only a few percent of the initial mass is lost during the main sequence evolution for metal-poor stars with Minit ≤ 30 M⊙).
We have estimated stellar masses of post-MS stars from comparison with SMC evolutionary models of Schootemeijer et al. (2019) with αSC = 10 and αOV = 0.33, i.e. consistent semiconvection and overshooting parameters to Brott et al. (2011) and Köhler et al. (2015), from which,
 (3)
(3)
with masses and luminosities in solar units, and TAMS lifetimes, t, in Myr
 (4)
(4)
These are flagged in Table A.2 via []. By way of example, an initial mass (stellar age) of  M⊙ (
M⊙ ( Myr) was obtained for Sk 179 (B3 II) from BONNSAI, versus
  M⊙ (
M⊙ ( Myr) from the TAMS luminosity based on Schootemeijer et al. (2019) models. Brott et al. (2011) models are known to predict unusually short main-sequence lifetimes (Marchant, priv. comm.).
The use of SMC metallicity models for seven LMC post-MS stars will (slightly) underestimate their cumulative mass-loss history, and in turn, introduce modest errors to initial mass calculations. In addition, current masses of post-MS stars in general may differ from the true mass since additional mass-loss may occur during the cool supergiant phase.
The distribution of initial masses of XShootU OB stars in each galaxy is presented in Fig. 9. In brief, the higher luminosities of LMC XShootU stars is reflected in 0.2 dex higher masses. Dwarfs in the SMC span 1.2 ≤ (log Minit/M⊙) ≤ 1.6, with the exception of two O3 V's, with supergiants primarily in the range 1.1 ≤ (log Minit/M⊙) ≤ 1.7, with a similar mass distribution for giants. In contrast, LMC dwarfs typically range from 1.4 ≤ (log Minit/M⊙) ≤ 1.8, supergiants span a broad mass range 1.2 ≤ (log Minit/M⊙) ≤ 2.1, again with a similar distribution for giants. Focusing on, for example, O6–8 dwarfs, average evolutionary masses are comparable for the SMC (27 ± 6 M⊙, N = 10) and LMC (31 ± 10 M⊙, N = 6). Martins et al. (2005) report stellar masses of 26 ± 5 M⊙ for O6–8 dwarfs, in their observational calibration of Galactic O stars.
Table A.2 also include stellar ages, and range from  Myr (e.g. Sk −67∘ 211) to
  Myr (e.g. Sk −67∘ 195). The range of evolutionary masses sampled is 10.8 ± 0.9 M⊙ for 2dFS 3947 (B1 IV) in the SMC to
  M⊙ for Sk –67∘ 211 (O 2 III(f*)) in the LMC. The median mass of all XShootU O stars (B stars) in the SMC is 32.3 M⊙ (19.6 M⊙), versus 46.0 M⊙ (27.3 M⊙) in the LMC.
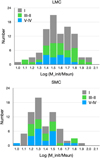 |
Fig. 9 Distribution of initial masses, Mini (in M⊙) of LMC (upper panel) and SMC (lower panel) ULLYSES OB stars (blue: V–IV, green III–II, grey: I), based on BONNSAI results using Brott et al. (2011) and Köhler et al. (2015) models for main sequence stars, or Schootemeijer et al. (2019) SMC evolutionary models for post-main sequence late B supergiants. |
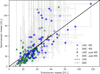 |
Fig. 10 Evolutionary versus spectroscopic masses (in M⊙) of LMC (blue) and SMC (green) OB stars, in which main sequence stars are circles/triangles and post-main sequence stars are squares/diamonds. Stars with unreliable surface gravities or uncertain stellar parameters are indicated with open symbols. The solid black line is a 1:1 relation, while dashed (dotted) black lines are fits to LMC (SMC) stars up to 60 M⊙. |
4.3.2 Spectroscopic masses
Alternatively, spectroscopic masses, Mspec, can be inferred from surface gravities and radii. Typical spectroscopic gravities presented in Table A.2 are log g/(cm s−2) = 3.7 ± 0.4 for O stars, log g/(cm s−2) = 2.7 ± 0.6 for B stars, though exclude contributions from centrifugal forces owing to rotation. Corrected gravities, gc, are obtained from Herrero et al. (1992)

These are included in Table A.2. In most instances corrections are modest, but can exceed 0.1 dex for rapid rotators e.g. log gc− log g = 0.23 dex for VFTS 190 with ve sin i ∼ 300 km s−1. Spectroscopic gravities are unrealistically high in some instances. By way of example the 06 Vz((f)) star N11 ELS 048 has an evolutionary mass of Mevol =  M⊙ but an unrealistically high spectroscopic gravity, implying an unphysical spectroscopic mass of
  M⊙. Such cases are indicated with parentheses in Tables A.1–A.2.
Spectroscopic masses are compared to inferred evolutionary masses in Fig. 10, separated into main sequence (MS) and post-MS populations, the latter selected for stars located beyond the terminal age main sequence (TAMS). There is a well established discrepancy between spectroscopic and evolutionary masses (Herrero et al. 1992), which is not so apparent from our analysis. Fits to evolutionary masses below 60 M⊙ are shown in Fig. 10 for LMC (SMC) as dashed (dotted) lines, above which there are too few stars to draw conclusions. For main sequence stars, evolutionary masses are often considered to be more realistic, in spite of challenges with evolutionary calculations.
Ultimately, a careful analysis of eclipsing binaries may be necessary to address the mass discrepancy (Tkachenko et al. 2020). Several XshootU targets are known eclipsing binaries (Tables A.3–A.4), plus some targets that are apparently single or SB1 binaries have been identified as double-lined SB2 binaries from spectroscopic monitoring (e.g. VFTS 482, Pollock et al. 2024). By way of example, the inferred evolutionary mass of VFTS 482 from our analysis is 101 ± 26 M⊙, yet Pollock et al. (2024) infer minimum dynamical masses of 105 M⊙ and 80 M⊙ for the O2.5 If/WN6 primary and O3 V-III secondary, respectively.
Figure 11 presents a spectroscopic HR (sHR) diagram (Langer & Kudritzki 2014) of the XShootU Magellanic Cloud OB stars, where  , emphasising their extreme nature. Indeed some evolved B supergiants in both galaxies approach the Eddington limit, with surface gravities close to the low limit of the grid at log g/(cm s−2) = 1.5. Spectroscopic gravities of some late B supergiants are unreliable since they lead to unphysically low spectroscopic masses, potentially owing to assumptions in our pipeline analyses. By way of example, log gc/(cm s−2) =
  for Sk −66∘ 50 (B 7 Ia+) implies Mspec =
  M⊙, versus Mevol =
  from inspection of Schootemeijer et al. (2019) tracks.
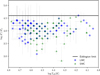 |
Fig. 11 Pipeline results (LMC: blue circles, SMC: green triangles) presented in a spectroscopic HR diagram, with Teff in K, together with the Eddington limit for X = 73%, at |

4.4 Ionizing photon rates
Results presented in Table A.1 include hydrogen (λ ≤ 912 Å, QH) and helium (λ ≤ 504 Å, QHeI) ionizing photon rates (s−1). As expected, the hottest stars (early O-type) dominate the Lyman and especially the helium continuum ionizing production, as shown in Fig. 12. Very massive main sequence WN and classical Wolf–Rayet stars can also play a major role (Doran et al. 2013; Crowther et al. 2022), although these were not included in this analysis, as discussed earlier. Ionizing properties of XShootU OB stars are relevant for studies of H II regions in the Magellanic Clouds, whose spectroscopic properties are being characterized by the SDSS-V Local Volume Mapper (Drory et al. 2024).
Ionized helium (λ ≤ 228 Å, QHeII) outputs are not included since these are modest for O stars and are strongly dependent on X-ray production. Indeed, relatively few XShootU targets have been detected in X-rays. The majority of these either host a compact object – examples include LMC X-4 (Hutchings et al. 1978) and SMC X-1 (Reynolds et al. 1993) – or are known colliding wind binaries (HD 5980, Nazé et al. 2002). Several XShootU targets in the Tarantula Nebula have been detected in the deep T-ReX survey (Crowther et al. 2022; Townsley et al. 2024), but detection of the bulk of the OB population in the Magellanic Clouds awaits a high spatial resolution, high throughout X-ray mission.
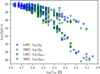 |
Fig. 12 Hydrogen (circles) and neutral helium (squares) ionizing photon rates (s−1) of LMC (blue) and SMC (green) OB stars, versus Teff. |
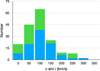 |
Fig. 13 Histogram of projected rotational velocities ve sin i (km s−1) for LMC (blue) and SMC (green) OB stars, in 50 km s−1 bins aside from 0 bin i.e. 50 refers to 50 ± 25 km s−1. There are few rapid rotators amongst the XShootU sample. |
4.5 Rotational velocities
The distribution of rotational velocities for XShootU stars are presented in Fig. 13. For the LMC (SMC) stars, average values are ve sin i = 121 ± 61 (108 ± 75) km s−1 for O stars and 64 ± 41 (62 ± 50) km s−1 for B stars. There are relatively few fast rotators amongst the XShootU sample, with only 10% of OB stars ve sin i ≥ 200 km s−1, and only 1% above ve sin i ≥ 300 km s−1. Stars with the highest rotational velocities (∼ 300 km s−1) are flagged as such via ‘n’ or ‘nn’ spectral classifications, and are rarer than from unbiased surveys such as VFTS (Evans et al. 2011) or BLOeM (Shenar et al. 2024). As anticipated, most B supergiants in both galaxies are slow rotators.
4.6 Elemental abundances
Helium is our primary focus regarding elemental abundances in XShootU OB stars. The baseline He abundance from H II regions (Russell & Dopita 1990) is Y ∼ 25%, whereas our grid permits lower helium mass fractions to avoid a truncated PDF. Such results should be viewed with caution. In contrast, high He mass fractions for a significant subset of OB supergiants are more credible. Indeed, the upper limit of Y = 55% from our grid is obtained for some B supergiants, although such results are sensitive to the robustness of the derived Teff, log g.
Fig. 14 compares projected rotational velocities to Y, surface Helium mass fractions. It is apparent that there is no clear relationship between these properties, suggesting that processes other than rotation may dominate surface He enrichment. However, one should bear in mind that mixing depends on several parameters, and the present sample is deliberately heterogeneous.
Martins et al. (2024) undertake a detailed study of CNO abundances in non-supergiant XShootU OB stars. We focus on estimating nitrogen abundances in early O stars, whose baseline values are log (N/H) + 12 = 7.03 in the LMC and 6.66 in the SMC (Vink et al. 2023) by number. For the LMC, nitrogen abundances range from baseline values to moderate enrichment in some (super)giants to fully processed nitrogen for some early O (super)giants and Of/WN stars. For the SMC, modest enrichment is obtained for some early O dwarfs, with nitrogen fully processed in a few instances (e.g. NGC 346 MPG 355, ON2 III(f*)).
The overwhelming majority of main sequence evolutionary models (Brott et al. 2011) predict no surface He or N enrichment for the optimised BONNSAI parameters (Teff, log L/L⊙, ve sin i). These are in clear tension with the preferred He and N mass fractions, indicating deficiencies in current evolutionary models for single stars or other processes at play (e.g. close binary evolution). By way of example, our analysis of the high mass LMC supergiant VFTS 545 (O2 If*/WN5, Mk 35) reveals considerable helium  and nitrogen (log N/H + 12 = 8.7 ± 0.2) enrichment, in spite of a negligible projected rotational velocity. Meanwhile the BONNSAI solution that is consistent with spectroscopic parameters (Teff, log L/L⊙, ve sin i) predicts
  and
and  . Similarly, the pipeline solution for the SMC B2 supergiant AzV 18 (Sk 13) favours the maximum helium enrichment
  whereas the BONNSAI solution for spectroscopic parameters predicts no He enrichment
  .
.
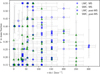 |
Fig. 14 Projected ve sin i (km s−1) versus He mass fractions for LMC (blue) and SMC (green) main sequence and post-main sequence stars. |
5 Wind properties of Magellanic Cloud OB stars
The physical parameters of Magellanic Cloud OB stars is the primary focus of the present study, rather than their wind properties. Ultraviolet (ULLYSES) datasets are crucial for the latter, especially for stars with relatively weak winds (Vink et al. 2023). Nevertheless, our diagnostics include Hα, our grid spans a wide range of wind densities, such that estimates of mass-loss rates can be made, at least for those stars with relatively high wind densities log Q ≥ −13.2.
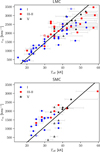 |
Fig. 15 Comparison between pipeline temperatures (kK) and empirical wind velocities, v∞, obtained either from SEI fits (quality i or ii filled symbols; quality iii open symbols) or vblack (open symbols) for OB dwarfs (blue circles), giants (red squares) and supergiants (black triangles), for the LMC (upper panel) and SMC (lower panel) together with the v∞ − Teff calibration from Hawcroft et al. (2024, solid black line). |
5.1 Wind velocities
The metallicity-dependent v∞ − Teff calibration Hawcroft et al. 2024 adopted for our grid-based pipeline analysis is based upon SEI-derived terminal wind velocities from ULLYSES observations of C IV λλ1548–51 (Hawcroft et al. 2024) plus literature-based temperatures. SEI-derived velocities from strong wind profiles (quality flags i or ii as defined by Hawcroft et al. (2024)) should be fairly robust despite adopting a uniform Doppler shift of 146 km s−1 (262 km s−1) for SMC (LMC) stars. For stars lacking an SEI measurement, or for which SEI quality flags were poor (weak or negligible wind signature), we have determined wind velocities either from vblack (Prinja et al. 1990) or v∞ ∼eq 0.85 vedge (Prinja & Crowther 1998; Crowther et al. 2016) using C IV λ1548, N V λ1238 or Si IV λ1394, after applying individual radial velocities from our study. These are presented in Table A.2.
We have reassessed the v∞ – Teff calibration of Hawcroft et al. (2024), specifically the combined literature sample for each galaxy used in their Table 1, by substituting literature temperatures for ULLYSES stars for pipeline results. This is presented in Fig. 15 (fit quality flags i–ii are filled symbols, open symbols otherwise).
For LMC OB stars, the calibration provides reasonable wind velocities, though highlights the large temperature uncertainties of early O stars discussed in Sect. 4.1). For SMC OB stars, wind velocities are generally underpredicted, especially for cooler OB supergiants. Hawcroft et al. (2024) included three B supergiants with reliable wind velocities for which Teff < 25 kK, with a mean v∞ = 690 km s−1. Two of these supergiants are in common with our sample (AzV 78 is not an original ULLYSES target), to which we have added AzV 242, resulting in a higher mean v∞ = 867 km s−1 (Fig. 15), favouring a somewhat shallower gradient. Telford et al. (2024) provide terminal wind velocities for O stars in other metal-poor galaxies.
For our subsequent analysis, including determination of mass-loss rates from wind densities Q, we have either selected individual values from Hawcroft et al. (2024) or measured wind velocities from ULLYSES spectroscopy. Indeed, a subset of ULLYSES targets were observed after the study of Hawcroft et al. (2024), for which additional determinations are made, following an identical procedure.
In a few instances, significantly higher velocities are obtained from vedge of N V λ1238 versus an SEI fit to C IV λ1548. These predominantly possess modest wind densities (e.g. AzV 377), so do not impact on wind momenta relations presented in Section 5.2. Wind velocities are generally similiar to previous determinations (e.g. Bouret et al. 2013), although in some cases previous work adopts standard v∞−vesc scaling relations (Lamers et al. 1995).
Figure 16 presents the temperature dependence of v∞/vesc for LMC (blue) and SMC (green) OB stars together with the Lamers et al. (1995) relation for Milky Way stars. vesc is determined from evolutionary masses, via

where Γe is the Eddington parameter (e.g. Groenewegen et al. 1989). Sk −69∘ 212 (O4.5 If) has been excluded from this diagram since Γe ∼ 1. We favour evolutionary masses over spectroscopic masses owing to unrealistic values of the latter in some instances (recall Sect. 4.3). The Lamers et al. (1995) relation is a reasonable approximation for LMC OB stars, but lower v∞/vesc ratios are obtained for SMC stars, with a sizeable subset of late O and early B stars revealing v∞/vesc ≪ 1. Wind velocities are difficult to measure for the majority of SMC stars, but there is no UV spectroscopic evidence of fast winds for many OB stars from the ULLYSES sample.
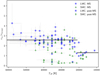 |
Fig. 16 Temperature dependence of v∞/vesc for LMC (SMC) main sequence stars shown as blue circles (green triangles) and post-main sequence stars shown as blue squares (green diamonds), together with the Lamers et al. (1995) relation for Milky Way stars. v∞/vesc ≪ 1 for a sizeable subset of (mostly) SMC OB stars. |
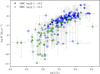 |
Fig. 17 Inferred mass-loss rates of LMC (blue circles) and SMC (green triangles) OB stars versus luminosity, in which stars with weak winds (log Q ≤ −13.2) or uncertain stellar parameters are indicated with open symbols. |
5.2 Mass-loss rates
Empirical wind velocities have permitted us to estimate massloss rates of OB stars from our pipeline wind densities. It is widely accepted that winds from hot luminous stars are clumped (Owocki et al. 1988; Hillier 1991; Sundqvist et al. 2011). To estimate mass-loss rates we have therefore adopted a clumping factor of 10 or volume filling factor of fv = 0.1 (Crowther et al. 2002; Evans et al. 2006), i.e. the derived rates are a factor of  lower than they would be with a smooth wind assumption.
Figure 17 presents inferred mass-loss rates of XShootU OB stars in the LMC and SMC. Filled symbols indicate stars with strong winds (log Q ≥ −13.2) while open symbols indicate stars with either weak winds or Hα fits affected by nebular emission. Inferred mass-loss rates of stars with strong winds typically lie in the range −7 ≤ log Ṁ/(M⊙ yr−1) ≤ −5.5. Overall OB stars in the LMC exhibit somewhat higher mass-loss rates than their SMC counterparts, many of which have low wind densities (open symbols).
Wind properties of OB stars in different environments are most directly compared via their (reduced) wind momenta,

with units of g cm s−2 (Kudritzki et al. 1999). Figure 18 shows a fit to wind momenta versus stellar luminosities for XShootU OB stars (upper panel), O stars (middle panel) and B stars (lower panel), excluding stars whose parameters are not considered reliable (e.g. Sk −68∘ 135). A significant subset of the SMC sample possess relatively weak winds (log Q ≤ −13.2), as indicated with open symbols in Fig. 18.
If we limit our sample to stars with wind densities of log Q ≥ −13.2, plus individual wind velocities (presented in Table A.2), we can parameterize their wind momenta as follows

Fits are presented in Fig. 18. We find, on average, ∼ 0.27 dex higher wind momenta for O stars in the LMC with respect to the SMC for 5.5 ≤ log (L/L⊙) ≤ 6.0, as indicated in Fig. 18.
Comparison between fits to wind momenta of SMC and LMC OB stars according to Mokiem et al. (2007b) using optical spectroscopy with wind velocities largely estimated from vesc scaling relations, plus this study, for OB stars with dense winds (log Q ≥ −13.2), plus empirical wind velocities.
Wind velocities scale with Z0.22 ± 0.03 according to Hawcroft et al. (2024) suggesting Ṁ ∝ Z0.5 for luminous O stars. Our results suggest a somewhat weaker metallicity dependence of mass-loss rates than those predicted by Vink et al. (2001), for which Ṁ ∝ Z0.7 is widely used in evolutionary calculations (see also Björklund et al. 2023), though support updated Monte Carlo models (Vink & Sander 2021).
Observationally, Mokiem et al. (2007b) have determined wind properties of Magellanic Cloud OB stars from analysis of visual spectroscopy, including Hα. They obtained Ṁ ∝ Z0.83 ± 0.16 by adopting a previous theoretical relation between wind velocity and metallicity v∞ ∝ Z0.13 (Leitherer et al. 1992). Use of v∞ ∝ Z0.22 from Hawcroft et al. (2024) would lead to a revised metallicity dependence of Ṁ ∝ Z0.74, in close agreement with theory, albeit a stronger dependence than from our results. Mokiem et al. (2007b) included O stars with somewhat lower luminosities which are known to possess very weak winds at late O spectral types (Marcolino et al. 2009; Rickard et al. 2022), considered wind clumping solely for Hα emission line stars, and crucially relied on indirect wind velocity indicators in most instances (e.g. v∞/vesc relations). Table 2 compares wind momentum coefficients from Mokiem et al. (2007b) to our results.
We separately consider B stars in the lower panel of Fig. 18, most of which are supergiants given our log Q ≥ −13.2 wind density criteria. However, considering our modest sample and reliance on Hα, we defer to quantitative studies which include UV diagnostics (Bouret et al. 2021; Bernini-Peron et al. 2024), which are more suitable for a comprehensive comparison with theoretical predictions.
6 Comparison to physical and wind properties from the literature
Previous quantitative studies have included large samples of O stars (e.g. Sabín-Sanjulián et al. 2017; Ramírez-Agudelo et al. 2017) but our study is unprecedented in its breadth (early O to late B), access to UV spectroscopy from ULLYSES, and demonstrates the capabilities of the pipeline (Bestenlehner et al. 2024) applied to large grids of synthetic spectra computed with FASTWIND (Puls et al. 2005; Rivero González et al. 2012).
Many of the XShootU sample stars were subject to earlier quantitative spectral analysis efforts using via optical or optical+UV spectroscopy. Since our analysis is restricted to optical diagnostics we compare our derived physical parameters to representative literature results in Table C.1. Typically, previous studies have employed FASTWIND with a Genetic Algorithm (GA) approach (Mokiem et al. 2006, 2007a) although some analyses involved fitting lines by-eye (Trundle et al. 2004; Massey et al. 2009) or PoWR (Ramachandran et al. 2018b). The majority of Magellanic Cloud studies of OB stars with CMFGEN (Hillier & Miller 1998) involve fits to UV and optical diagnostics (e.g. Hillier et al. 2003; Evans et al. 2004a). Massey et al. (2013) compare properties of OB stars obtained with CMFGEN and FASTWIND.
Overall temperatures, gravities and luminosities obtained from our pipeline agree with detailed studies within the uncertainties, at least for the targets listed. We consider our errors to be more realistic given the number of parameters involved. Our estimated mass-loss rates are however less reliable since Hα is a poor diagnostic of stars with weak winds. Literature stellar parameters for a large subset of ULLYSES targets are provided in Table B. 2 of Vink et al. (2023).
Recently, a subset of ULLYSES/XShootU targets have been the subject of detailed UV and optical quantitative studies. LMC studies have included FASTWIND GA analyses of OB supergiants by Verhamme et al. (2024) and O stars by Brands et al. (2024), plus PoWR analyses of O stars by Gómez-González et al. (2025), while SMC studies have included FASTWIND GA analyses of O stars by Backs et al. (2024) and CMFGEN studies of B supergiants by Bernini-Peron et al. (2024).
The upper panel of Figure 19 compares pipeline-derived temperatures Teff with detailed results ΔTeff = [Teff. (pipeline) – Teff (study)]/Teff (study). Satisfactory results are obtained for the majority of stars in common, albeit with some scatter. Nevertheless, there are several early O stars in the LMC for which significantly higher (and highly uncertain) temperatures are obtained with respect to Brands et al. (2024). In addition, pipeline-derived temperatures of some SMC mid B supergiants are also significantly higher than Bernini-Peron et al. (2024). Open symbols indicate suspected binaries according to Backs et al. (2024) and Brands et al. (2024).
The middle panel of Figure 19 compares pipeline-derived surface gravities with other XShootU studies, uncorrected for centrifugal effects, where Δ log g = log g (pipeline) − log g (study). Overall agreement is generally good, albeit with large uncertainties in a number of instances. The lower panel of Figure 19 compares pipeline-derived luminosities with other XShootU studies, where Δ log L/L⊙ = log L/L⊙ (pipeline) log L/L⊙ (study). Once again, agreement is satisfactory, aside from a few outliers. Our results support the non-negligible scatter in results discussed in Sander et al. (2024) for three XShootU O stars analysed using various techniques.
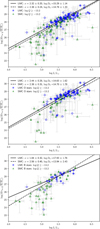 |
Fig. 18 (Reduced) wind momentum versus luminosity results for LMC (blue circles) and SMC (green triangles) OB (upper panel), O (middle panel) and B (lower panel) stars. Wind velocities lacking empirical results are obtained from the calibration of Hawcroft et al. (2024). Stars with weak winds (log Q ≤ −13.2) or uncertain stellar parameters are indicated with open symbols. |
7 Conclusions
We have presented a study of XShootU spectroscopy of 122 LMC and 103 SMC OB stars. In constast with previous studies that focus on a relatively narrow subset of spectral type and/or luminosity class, our analysis pipeline (Bestenlehner et al. 2024) spans early O dwarfs to late B supergiants across both Magellanic Clouds, permitting
Uniform spectral classification from the homogeneous XShootU dataset, permitting double-lined binaries and OeBe stars to be identified (Tables A.3-A.4). With respect to literature spectral types we have confirmed a deficit of early O stars amongst the SMC ULLYSES sample, and have identified a deficit of late B supergiants in the SMC sample (all 3 stars later than B3 are B8 supergiants), as shown in Fig. 3;
Excluding OeBe and double lined binaries, we have quantitatively analysed 97 LMC and 77 SMC OB stars (Tables A.1–A.2). We have established that ULLYSES O stars in the LMC are more luminous (massive) than SMC counterparts (see Figs. 7 and 9), with implications for evolutionary and stellar wind comparisons. High temperature O stars dominate the production of hydrogen and helium ionizing photons (Fig. 12);
Projected rotational velocities are modest, with only ∼ 10% of XShootU OB stars possessing ve sin i ≥ 200 km s−1 (Fig. 13);
We have compared empirical wind velocities from ULLYSES to the temperature-wind velocity relation of Hawcroft et al. (2024) indicating that the calibration provides an upper envelope to wind velocities (Fig. 15). The Milky Way v∞/vesc relation from Lamers et al. (1995) is a reasonable approximation to LMC OB stars – albeit with a large observational scatter – whereas SMC OB stars reveal a lower ratio, with v∞/vesc ≪ 1 in some instances (Fig. 16);
We have used empirical wind velocities to compare (reduced) wind momenta, Dmom = Ṁ v∞ (R*/R⊙)0.5, of LMC and SMC OB stars with dense winds, log Q = Ṁ(R* v∞)−3/2 ≥–13.2, and find LMC luminous O stars exceed SMC counterparts by ∼ 0.27 dex (Fig. 18). Since Hα is only a reliable indicator of mass-loss rates for stars with strong winds, we defer to detailed ULLYSES + XShootU studies (e.g. Backs et al. 2024) for weak-wind stars;
Overall our analysis pipeline results are in satisfactory agreement with bespoke studies of OB stars in the Magellanic Clouds (Table C.1, Fig. 19). Therefore, we consider our pipeline to be well suited to the upcoming very large spectroscopic surveys such as 1001MC (Cioni et al. 2019).
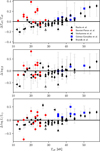 |
Fig. 19 Comparison between pipeline-derived Teff and ΔTeff/Teff (upper panel), Δ log g (middle panel), Δ log L/L⊙ (lower panel) from detailed XShootU analyses of OB stars using FASTWIND (black), CMFGEN (red) and PoWR (blue). Positive values indicate higher quantities from pipeline. Open symbols are suspected binaries according to Backs et al. (2024) and Brands et al. (2024). |
Data availability
Tables A.1–A.2 containing physical and wind properties of single and SB1 binaries, plus Tables A.3–A.4 providing updated spectral types for those stars excluded from analysis are available at the CDS via anonymous ftp to cdsarc.cds.unistra.fr (130.79.128.5) or via https://cdsarc.cds.unistra.fr/viz-bin/cat/J/A+A/695/A198.
Online material at https://doi.org/10.5281/zenodo.14756111 includes Figs. B.1–B.8, plus spectral fits and spectral energy distribution comparisons for each star (model in red, observations in blue), in alphabetical order. Photometry (indicated as stars) is drawn from Vink et al. (2023).
Acknowledgements
This study has been made possible courtesy of the Director's Discretionary ULLYSES survey, which was implemented by a Space Telescope Science Institute (STScI) team led by Julia Roman-Duval, having been recommended by the Hubble UV Legacy Science Definition Working Group chaired by Sally Oey, convened in 2018 by the STScI Director Ken Sembach. Based on observations made with ESO telescopes at the Paranal observatory under programme ID 106.211Z. 001 and observations obtained with the NASA/ESA Hubble Space Telescope, retrieved from the Mikulski Archive for Space Telescopes (MAST) at the STScI. STScI is operated by the Association of Universities for Research in Astronomy, Inc. under NASA contract NAS 526555. Nidia Morrell kindly obtained and reduced the Magellan Clay MIKE spectroscopic datasets. JMB and PAC acknowledge financial support from the Science and Technology Facilities Council via research grant ST/V000853/1 (P.I. Vik Dhillon). AACS is supported by the German Deutsche Forschungsgemeinschaft, DFG in the form of an Emmy Noether Research Group – Project-ID 445674056 (SA4064/1–1, PI Sander). SB is supported by a grant from the Dutch Research School for Astronomy (NOVA). This research has made use of the SIMBAD database, operated at CDS, Strasbourg, France, FASTWIND stellar atmosphere code developed by Joachim Puls, and BONNSAI software developed by Fabian Schneider. We appreciate comments on a draft manuscript from Matheus Bernini-Peron, Rolf Kuiper, Lucimara Martins, Varsha Ramachandran and Aida Wofford, plus discussions regarding masses of post-main sequence massive stars with Norbert Langer, Pablo Marchant and Fabian Schneider.
Appendix C Comparison with literature results
Comparison of physical and wind parameters of selected XShootU OB stars from this study with representative literature results based on optical diagnostics. All analyses involve FASTWIND (Puls et al. 2005; Rivero González et al. 2012) with the exception of Sk −71∘ 41 which used PoWR (Gräfener et al. 2002; Sander et al. 2015).
References
- Abbott, B. P., Abbott, R., Abbott, T. D., et al. 2016, Phys. Rev. X, 6, 041015 [Google Scholar]
- Arellano-Córdova, K. Z., Berg, D. A., Chisholm, J., et al. 2022, ApJ, 940, L23 [CrossRef] [Google Scholar]
- Backs, F., Brands, S. A., de Koter, A., et al. 2024, A&A, 692, A88 [NASA ADS] [CrossRef] [EDP Sciences] [Google Scholar]
- Bernini-Peron, M., Sander, A. A. C., Ramachandran, V., et al. 2024, A&A, 692, A89 [NASA ADS] [CrossRef] [EDP Sciences] [Google Scholar]
- Bestenlehner, J. M. 2020, MNRAS, 493, 3938 [Google Scholar]
- Bestenlehner, J. M., Gräfener, G., Vink, J. S., et al. 2014, A&A, 570, A38 [NASA ADS] [CrossRef] [EDP Sciences] [Google Scholar]
- Bestenlehner, J. M., Enßlin, T., Bergemann, M., et al. 2024, MNRAS, 528, 6735 [CrossRef] [Google Scholar]
- Björklund, R., Sundqvist, J. O., Singh, S. M., Puls, J., & Najarro, F. 2023, A&A, 676, A109 [NASA ADS] [CrossRef] [EDP Sciences] [Google Scholar]
- Blair, W. P., Oliveira, C., LaMassa, S., et al. 2009, PASP, 121, 634 [NASA ADS] [CrossRef] [Google Scholar]
- Bouret, J. C., Lanz, T., Hillier, D. J., et al. 2003, ApJ, 595, 1182 [NASA ADS] [CrossRef] [Google Scholar]
- Bouret, J. C., Lanz, T., Martins, F., et al. 2013, A&A, 555, A1 [NASA ADS] [CrossRef] [EDP Sciences] [Google Scholar]
- Bouret, J. C., Martins, F., Hillier, D. J., et al. 2021, A&A, 647, A134 [NASA ADS] [CrossRef] [EDP Sciences] [Google Scholar]
- Brands, S. A., Backs, F., de Koter, A., et al. 2024, A&A, submitted [Google Scholar]
- Brott, I., de Mink, S. E., Cantiello, M., et al. 2011, A&A, 530, A115 [NASA ADS] [CrossRef] [EDP Sciences] [Google Scholar]
- Bruzual, G., & Charlot, S. 2003, MNRAS, 344, 1000 [NASA ADS] [CrossRef] [Google Scholar]
- Cameron, A. J., Saxena, A., Bunker, A. J., et al. 2023, A&A, 677, A115 [NASA ADS] [CrossRef] [EDP Sciences] [Google Scholar]
- Cioni, M. R. L., Storm, J., Bell, C. P. M., et al. 2019, The Messenger, 175, 54 [NASA ADS] [Google Scholar]
- Conti, P. S., Garmany, C. D., & Massey, P. 1986, AJ, 92, 48 [NASA ADS] [CrossRef] [Google Scholar]
- Crampton, D., & Greasley, J. 1982, PASP, 94, 31 [NASA ADS] [CrossRef] [Google Scholar]
- Crowther, P. A. 2019, Galaxies, 7, 88 [Google Scholar]
- Crowther, P. A. 2022, in IAU Symposium, 361, Massive Stars Near and Far, eds. J. Mackey, J. S. Vink, & N. St-Louis, 15 [NASA ADS] [CrossRef] [Google Scholar]
- Crowther, P. A., & Castro, N. 2024, MNRAS, 527, 9023 [Google Scholar]
- Crowther, P. A., & Smith, L. J. 1997, A&A, 320, 500 [NASA ADS] [Google Scholar]
- Crowther, P. A., & Walborn, N. R. 2011, MNRAS, 416, 1311 [Google Scholar]
- Crowther, P. A., Hillier, D. J., Evans, C. J., et al. 2002, ApJ, 579, 774 [Google Scholar]
- Crowther, P. A., Caballero-Nieves, S. M., Bostroem, K. A., et al. 2016, MNRAS, 458, 624 [Google Scholar]
- Crowther, P. A., Broos, P. S., Townsley, L. K., et al. 2022, MNRAS, 515, 4130 [NASA ADS] [CrossRef] [Google Scholar]
- Curti, M., Maiolino, R., Curtis-Lake, E., et al. 2024, A&A, 684, A75 [NASA ADS] [CrossRef] [EDP Sciences] [Google Scholar]
- de Mink, S. E., Sana, H., Langer, N., Izzard, R. G., & Schneider, F. R. N., 2014, ApJ, 782, 7 [Google Scholar]
- Doran, E. I., Crowther, P. A., de Koter, A., et al. 2013, A&A, 558, A134 [NASA ADS] [CrossRef] [EDP Sciences] [Google Scholar]
- Drory, N., Blanc, G. A., Kreckel, K., et al. 2024, AJ, 168, 198 [NASA ADS] [CrossRef] [Google Scholar]
- Dufton, P. L., Langer, N., Dunstall, P. R., et al. 2013, A&A, 550, A109 [NASA ADS] [CrossRef] [EDP Sciences] [Google Scholar]
- Dufton, P. L., Evans, C. J., Hunter, I., Lennon, D. J., & Schneider, F. R. N., 2019, A&A, 626, A50 [NASA ADS] [CrossRef] [EDP Sciences] [Google Scholar]
- Evans, C. J., Crowther, P. A., Fullerton, A. W., & Hillier, D. J. 2004a, ApJ, 610 1021 [NASA ADS] [CrossRef] [Google Scholar]
- Evans, C. J., Howarth, I. D., Irwin, M. J., Burnley, A. W., & Harries, T. J. 2004b, MNRAS, 353, 601 [NASA ADS] [CrossRef] [Google Scholar]
- Evans, C. J., Lennon, D. J., Smartt, S. J., & Trundle, C. 2006, A&A, 456, 623 [CrossRef] [EDP Sciences] [Google Scholar]
- Evans, C. J., Taylor, W. D., Hénault-Brunet, V., et al. 2011, A&A, 530, A108 [NASA ADS] [CrossRef] [EDP Sciences] [Google Scholar]
- Evans, C. J., Kennedy, M. B., Dufton, P. L., et al. 2015a, A&A, 574, A13 [NASA ADS] [CrossRef] [EDP Sciences] [Google Scholar]
- Evans, C. J., van Loon, J. T., Hainich, R., & Bailey, M. 2015b, A&A, 584, A5 [NASA ADS] [CrossRef] [EDP Sciences] [Google Scholar]
- Fariña, C., Bosch, G. L., Morrell, N. I., Barbá, R. H., & Walborn, N. R. 2009, AJ, 138, 510 [CrossRef] [Google Scholar]
- Fitzpatrick, E. L. 1988, ApJ, 335, 703 [NASA ADS] [CrossRef] [Google Scholar]
- Fitzpatrick, E. L. 1991, PASP, 103, 1123 [NASA ADS] [CrossRef] [Google Scholar]
- Foellmi, C., Moffat, A. F. J., & Guerrero, M. A. 2003, MNRAS, 338, 360 [NASA ADS] [CrossRef] [Google Scholar]
- Garcia, M., Evans, C. J., Bestenlehner, J. M., et al. 2019, arXiv e-prints [arXiv:1908.04687] [Google Scholar]
- Garmany, C. D., & Walborn, N. R. 1987, PASP, 99, 240 [NASA ADS] [CrossRef] [Google Scholar]
- Garmany, C. D., Conti, P. S., & Massey, P. 1987, AJ, 93, 1070 [NASA ADS] [CrossRef] [Google Scholar]
- Gómez-González, V. M. A., Oskinova, L. M., Hamann, W.-R., et al. 2025, A&A, 695, A197 [NASA ADS] [CrossRef] [EDP Sciences] [Google Scholar]
- Graczyk, D., Soszyński, I., Poleski, R., et al. 2011, Acta Astron., 61, 103 [Google Scholar]
- Graczyk, D., Pietrzyński, G., Thompson, I. B., et al. 2020, ApJ, 904, 13 [Google Scholar]
- Gräfener, G., Koesterke, L., & Hamann, W. R. 2002, A&A, 387, 244 [NASA ADS] [CrossRef] [EDP Sciences] [Google Scholar]
- Groenewegen, M. A. T., Lamers, H. J. G. L. M., & Pauldrach, A. W. A., 1989, A&A, 221, 78 [NASA ADS] [Google Scholar]
- Gvaramadze, V. V., Kniazev, A. Y., Maryeva, O. V., & Berdnikov, L. N. 2018, MNRAS, 474, 1412 [NASA ADS] [CrossRef] [Google Scholar]
- Hawcroft, C., Sana, H., Mahy, L., et al. 2024, A&A, 688, A105 [NASA ADS] [CrossRef] [EDP Sciences] [Google Scholar]
- Herrero, A., Kudritzki, R. P., Vilchez, J. M., et al. 1992, A&A, 261, 209 [NASA ADS] [Google Scholar]
- Hillier, D. J. 1991, A&A, 247, 455 [NASA ADS] [Google Scholar]
- Hillier, D. J., & Miller, D. L. 1998, ApJ, 496, 407 [NASA ADS] [CrossRef] [Google Scholar]
- Hillier, D. J., Lanz, T., Heap, S. R., et al. 2003, ApJ, 588, 1039 [Google Scholar]
- Howarth, I. D., & Prinja, R. K. 1989, ApJS, 69, 527 [NASA ADS] [CrossRef] [Google Scholar]
- Hutchings, J. B., Crampton, D., & Cowley, A. P. 1978, ApJ, 225, 548 [NASA ADS] [CrossRef] [Google Scholar]
- Koenigsberger, G., Morrell, N., Hillier, D. J., et al. 2014, AJ, 148, 62 [Google Scholar]
- Köhler, K., Langer, N., de Koter, A., et al. 2015, A&A, 573, A71 [NASA ADS] [CrossRef] [EDP Sciences] [Google Scholar]
- Kudritzki, R. P., Puls, J., Lennon, D. J., et al. 1999, A&A, 350, 970 [Google Scholar]
- Lamb, J. B., Oey, M. S., Graus, A. S., Adams, F. C., & Segura-Cox, D. M. 2013, ApJ, 763, 101 [NASA ADS] [CrossRef] [Google Scholar]
- Lamb, J. B., Oey, M. S., Segura-Cox, D. M., et al. 2016, ApJ, 817, 113 [NASA ADS] [CrossRef] [Google Scholar]
- Lamers, H. J. G. L. M., Snow, T. P., & Lindholm, D. M. 1995, ApJ, 455, 269 [Google Scholar]
- Lamers, H. J. G. L. M., Zickgraf, F.-J., de Winter, D., Houziaux, L., & Zorec, J. 1998, A&A, 340, 117 [NASA ADS] [Google Scholar]
- Langer, N. 2012, ARA&A, 50, 107 [CrossRef] [Google Scholar]
- Langer, N., & Kudritzki, R. P. 2014, A&A, 564, A52 [NASA ADS] [CrossRef] [EDP Sciences] [Google Scholar]
- Leitherer, C., Robert, C., & Drissen, L. 1992, ApJ, 401, 596 [Google Scholar]
- Leitherer, C., Ortiz Otálvaro, P. A., Bresolin, F., et al. 2010, ApJS, 189, 309 [Google Scholar]
- Lennon, D. J. 1997, A&A, 317, 871 [NASA ADS] [Google Scholar]
- Levan, A., Crowther, P., de Grijs, R., et al. 2016, Space Sci. Rev., 202, 33 [NASA ADS] [CrossRef] [Google Scholar]
- Mahy, L., Sana, H., Abdul-Masih, M., et al. 2020, A&A, 634, A118 [NASA ADS] [CrossRef] [EDP Sciences] [Google Scholar]
- Maíz Apellániz, J., Evans, C. J., Barbá, R. H., et al. 2014, A&A, 564, A63 [CrossRef] [EDP Sciences] [Google Scholar]
- Maíz Apellániz, J., Sota, A., Arias, J. I., et al. 2016, ApJS, 224, 4 [CrossRef] [Google Scholar]
- Marcolino, W. L. F., Bouret, J. C., Martins, F., et al. 2009, A&A, 498, 837 [NASA ADS] [CrossRef] [EDP Sciences] [Google Scholar]
- Martins, F., Schaerer, D., Hillier, D. J., et al. 2005, A&A, 441, 735 [NASA ADS] [CrossRef] [EDP Sciences] [Google Scholar]
- Martins, F., Bouret, J.-C., Hillier, D. J., et al. 2024, A&A, 689, A31 [NASA ADS] [CrossRef] [EDP Sciences] [Google Scholar]
- Massey, P. 2002, ApJS, 141, 81 [NASA ADS] [CrossRef] [Google Scholar]
- Massey, P., Lang, C. C., Degioia-Eastwood, K., & Garmany, C. D. 1995, ApJ, 438, 188 [NASA ADS] [CrossRef] [Google Scholar]
- Massey, P., Waterhouse, E., & DeGioia-Eastwood, K. 2000, AJ, 119, 2214 [NASA ADS] [CrossRef] [Google Scholar]
- Massey, P., Bresolin, F., Kudritzki, R. P., Puls, J., & Pauldrach, A. W. A., 2004, ApJ, 608, 1001 [Google Scholar]
- Massey, P., Puls, J., Pauldrach, A. W. A., et al. 2005, ApJ, 627, 477 [NASA ADS] [CrossRef] [Google Scholar]
- Massey, P., Zangari, A. M., Morrell, N. I., et al. 2009, ApJ, 692, 618 [Google Scholar]
- Massey, P., Neugent, K. F., Hillier, D. J., & Puls, J. 2013, ApJ, 768, 6 [Google Scholar]
- Massey, P., Neugent, K. F., & Morrell, N. 2017, ApJ, 837, 122 [NASA ADS] [CrossRef] [Google Scholar]
- Mennickent, R. E., Cidale, L., Pietrzyński, G., Gieren, W., & Sabogal, B. 2006, A&A, 457, 949 [NASA ADS] [CrossRef] [EDP Sciences] [Google Scholar]
- Millán-Irigoyen, I., Mollá, M., Cerviño, M., et al. 2021, MNRAS, 506, 4781 [CrossRef] [Google Scholar]
- Mokiem, M. R., de Koter, A., Evans, C. J., et al. 2006, A&A, 456, 1131 [NASA ADS] [CrossRef] [EDP Sciences] [Google Scholar]
- Mokiem, M. R., de Koter, A., Evans, C. J., et al. 2007a, A&A, 465, 1003 [NASA ADS] [CrossRef] [EDP Sciences] [Google Scholar]
- Mokiem, M. R., de Koter, A., Vink, J. S., et al. 2007b, A&A, 473, 603 [NASA ADS] [CrossRef] [EDP Sciences] [Google Scholar]
- Nazé, Y., Hartwell, J. M., Stevens, I. R., et al. 2002, ApJ, 580, 225 [CrossRef] [Google Scholar]
- Negueruela, I., & Coe, M. J. 2002, A&A, 385, 517 [NASA ADS] [CrossRef] [EDP Sciences] [Google Scholar]
- Negueruela, I., Simón-Díaz, S., de Burgos, A., Casasbuenas, A., & Beck, P. G. 2024, A&A, 690, A176 [NASA ADS] [CrossRef] [EDP Sciences] [Google Scholar]
- Niemela, V. S. 2002, in Extragalactic Star Clusters, 202, eds. D. P. Geisler, E. K. Grebel, & D. Minniti, 202 [NASA ADS] [Google Scholar]
- Niemela, V., & Gamen, R. 2004, New A Rev., 48, 727 [NASA ADS] [CrossRef] [Google Scholar]
- Oey, M. S., & Smedley, S. A. 1998, AJ, 116, 1263 [NASA ADS] [CrossRef] [Google Scholar]
- Ostrov, P. G., & Lapasset, E. 2003, MNRAS, 338, 141 [NASA ADS] [CrossRef] [Google Scholar]
- Owocki, S. P., Castor, J. I., & Rybicki, G. B. 1988, ApJ, 335, 914 [NASA ADS] [CrossRef] [Google Scholar]
- Parker, J. W., Garmany, C. D., Massey, P., & Walborn, N. R. 1992, AJ, 103, 1205 [NASA ADS] [CrossRef] [Google Scholar]
- Pauli, D., Oskinova, L. M., Hamann, W. R., et al. 2022, A&A, 659, A9 [NASA ADS] [CrossRef] [EDP Sciences] [Google Scholar]
- Pawlak, M., Graczyk, D., Soszyński, I., et al. 2013, Acta Astron., 63, 323 [NASA ADS] [Google Scholar]
- Pietrzyński, G., Graczyk, D., Gallenne, A., et al. 2019, Nature, 567, 200 [Google Scholar]
- Pollock, A. M. T., Crowther, P. A., Bestenlehner, J. M., Broos, P. S., Townsley, L. K. 2024, MNRAS submitted [Google Scholar]
- Prinja, R. K., & Crowther, P. A. 1998, MNRAS, 300, 828 [NASA ADS] [CrossRef] [Google Scholar]
- Prinja, R. K., Barlow, M. J., & Howarth, I. D. 1990, ApJ, 361, 607 [NASA ADS] [CrossRef] [Google Scholar]
- Puls, J., Urbaneja, M. A., Venero, R., et al. 2005, A&A, 435, 669 [NASA ADS] [CrossRef] [EDP Sciences] [Google Scholar]
- Ramachandran, V., Hainich, R., Hamann, W. R., et al. 2018a, A&A, 609, A7 [NASA ADS] [CrossRef] [EDP Sciences] [Google Scholar]
- Ramachandran, V., Hamann, W. R., Hainich, R., et al. 2018b, A&A, 615, A40 [NASA ADS] [CrossRef] [EDP Sciences] [Google Scholar]
- Ramachandran, V., Hamann, W. R., Oskinova, L. M., et al. 2019, A&A, 625, A104 [NASA ADS] [CrossRef] [EDP Sciences] [Google Scholar]
- Ramachandran, V., Sander, A. A. C., Pauli, D., et al. 2024, A&A, 692, A90 [NASA ADS] [CrossRef] [EDP Sciences] [Google Scholar]
- Ramírez-Agudelo, O. H., Simón-Díaz, S., Sana, H., et al. 2013, A&A, 560, A29 [NASA ADS] [CrossRef] [EDP Sciences] [Google Scholar]
- Ramírez-Agudelo, O. H., Sana, H., de Koter, A., et al. 2017, A&A, 600, A81 [NASA ADS] [CrossRef] [EDP Sciences] [Google Scholar]
- Reynolds, A. P., Hilditch, R. W., Bell, S. A., & Hill, G. 1993, MNRAS, 261, 337 [NASA ADS] [CrossRef] [Google Scholar]
- Rickard, M. J., Hainich, R., Hamann, W. R., et al. 2022, A&A, 666, A189 [NASA ADS] [CrossRef] [EDP Sciences] [Google Scholar]
- Ritchie, B. W., Stroud, V. E., Evans, C. J., et al. 2012, A&A, 537, A29 [NASA ADS] [CrossRef] [EDP Sciences] [Google Scholar]
- Rivero González, J. G., Puls, J., Najarro, F., & Brott, I. 2012, A&A, 537, A79 [NASA ADS] [CrossRef] [EDP Sciences] [Google Scholar]
- Roman-Duval, J., Proffitt, C. R., Taylor, J. M., et al. 2020, RNAASS, 4, 205 [Google Scholar]
- Rousseau, J., Martin, N., Prévot, L., et al. 1978, A&AS, 31, 243 [NASA ADS] [Google Scholar]
- Russell, S. C., & Dopita, M. A. 1990, ApJS, 74, 93 [NASA ADS] [CrossRef] [Google Scholar]
- Sabín-Sanjulián, C., Simón-Díaz, S., Herrero, A., et al. 2017, A&A, 601, A79 [NASA ADS] [CrossRef] [EDP Sciences] [Google Scholar]
- Sana, H., de Mink, S. E., de Koter, A., et al. 2012, Science, 337, 444 [Google Scholar]
- Sana, H., de Koter, A., de Mink, S. E., et al. 2013, A&A, 550, A107 [NASA ADS] [CrossRef] [EDP Sciences] [Google Scholar]
- Sana, H., Tramper, F., Abdul-Masih, M., et al. 2024, A&A, 688, A104 [NASA ADS] [CrossRef] [EDP Sciences] [Google Scholar]
- Sander, A., Shenar, T., Hainich, R., et al. 2015, A&A, 577, A13 [NASA ADS] [CrossRef] [EDP Sciences] [Google Scholar]
- Sander, A. A. C., Bouret, J.-C., Bernini-Peron, M., et al. 2024, A&A, 689, A30 [NASA ADS] [CrossRef] [EDP Sciences] [Google Scholar]
- Sanduleak, N. 1969, AJ, 74, 877 [NASA ADS] [CrossRef] [Google Scholar]
- Schneider, F. R. N., Langer, N., de Koter, A., et al. 2014, A&A, 570, A66 [NASA ADS] [CrossRef] [EDP Sciences] [Google Scholar]
- Schnurr, O., Moffat, A. F. J., St-Louis, N., Morrell, N. I., & Guerrero, M. A. 2008, MNRAS, 389, 806 [NASA ADS] [CrossRef] [Google Scholar]
- Schootemeijer, A., Langer, N., Grin, N. J., & Wang, C. 2019, A&A, 625, A132 [NASA ADS] [CrossRef] [EDP Sciences] [Google Scholar]
- Shenar, T., Hainich, R., Todt, H., et al. 2018, A&A, 616, A103 [NASA ADS] [CrossRef] [EDP Sciences] [Google Scholar]
- Shenar, T., Sablowski, D. P., Hainich, R., et al. 2019, A&A, 627, A151 [NASA ADS] [CrossRef] [EDP Sciences] [Google Scholar]
- Shenar, T., Sana, H., Mahy, L., et al. 2022, A&A, 665, A148 [NASA ADS] [CrossRef] [EDP Sciences] [Google Scholar]
- Shenar, T., Bodensteiner, J., Sana, H., et al. 2024, A&A, 690, A289 [NASA ADS] [CrossRef] [EDP Sciences] [Google Scholar]
- Smartt, S. J. 2015, PASA, 32, e016 [NASA ADS] [CrossRef] [Google Scholar]
- Smith, L. F., Shara, M. M., & Moffat, A. F. J., 1990, ApJ, 348, 471 [NASA ADS] [CrossRef] [Google Scholar]
- Smith, L. F., Shara, M. M., & Moffat, A. F. J., 1996, MNRAS, 281, 163 [NASA ADS] [CrossRef] [Google Scholar]
- Smith Neubig, M. M., & Bruhweiler, F. C. 1997, AJ, 114, 1951 [CrossRef] [Google Scholar]
- Sota, A., Maíz Apellániz, J., Walborn, N. R., et al. 2011, ApJS, 193, 24 [Google Scholar]
- Sundqvist, J. O., Puls, J., Feldmeier, A., & Owocki, S. P. 2011, A&A, 528, A64 [NASA ADS] [CrossRef] [EDP Sciences] [Google Scholar]
- Telford, O. G., Chisholm, J., McQuinn, K. B. W., & Berg, D. A. 2021, ApJ, 922, 191 [NASA ADS] [CrossRef] [Google Scholar]
- Telford, O. G., Chisholm, J., Sander, A. A. C., et al. 2024, ApJ, 974, 85 [NASA ADS] [Google Scholar]
- Tkachenko, A., Pavlovski, K., Johnston, C., et al. 2020, A&A, 637, A60 [NASA ADS] [CrossRef] [EDP Sciences] [Google Scholar]
- Townsley, L. K., Broos, P. S., & Povich, M. S. 2024, ApJS, 273, 5 [NASA ADS] [Google Scholar]
- Trundle, C., Lennon, D. J., Puls, J., & Dufton, P. L. 2004, A&A, 417, 217 [NASA ADS] [CrossRef] [EDP Sciences] [Google Scholar]
- Urbaneja, M. A., Kudritzki, R. P., Gieren, W., et al. 2017, AJ, 154, 102 [NASA ADS] [CrossRef] [Google Scholar]
- Verhamme, O., Sundqvist, J., de Koter, A., et al. 2024, A&A, 692, A91 [NASA ADS] [CrossRef] [EDP Sciences] [Google Scholar]
- Verro, K., Trager, S. C., Peletier, R. F., et al. 2022, A&A, 660, A34 [NASA ADS] [CrossRef] [EDP Sciences] [Google Scholar]
- Vink, J. S., & Sander, A. A. C., 2021, MNRAS, 504, 2051 [NASA ADS] [CrossRef] [Google Scholar]
- Vink, J. S., de Koter, A., & Lamers, H. J. G. L. M. 2001, A&A, 369, 574 [NASA ADS] [CrossRef] [EDP Sciences] [Google Scholar]
- Vink, J. S., Mehner, A., Crowther, P. A., et al. 2023, A&A, 675, A154 [NASA ADS] [CrossRef] [EDP Sciences] [Google Scholar]
- Walborn, N. R. 1971, ApJS, 23, 257 [NASA ADS] [CrossRef] [Google Scholar]
- Walborn, N. R. 1972, AJ, 77, 312 [NASA ADS] [CrossRef] [Google Scholar]
- Walborn, N. R. 1977, ApJ, 215, 53 [NASA ADS] [CrossRef] [Google Scholar]
- Walborn, N. R. 1983, ApJ, 265, 716 [NASA ADS] [CrossRef] [Google Scholar]
- Walborn, N. R., & Fitzpatrick, E. L. 1990, PASP, 102, 379 [Google Scholar]
- Walborn, N. R., Lennon, D. J., Haser, S. M., Kudritzki, R.-P., & Voels, S. A. 1995, PASP, 107, 104 [NASA ADS] [CrossRef] [Google Scholar]
- Walborn, N. R., Lennon, D. J., Heap, S. R., et al. 2000, PASP, 112, 1243 [Google Scholar]
- Walborn, N. R., Fullerton, A. W., Crowther, P. A., et al. 2002a, ApJS, 141, 443 [NASA ADS] [CrossRef] [Google Scholar]
- Walborn, N. R., Howarth, I. D., Lennon, D. J., et al. 2002b, AJ, 123, 2754 [NASA ADS] [CrossRef] [Google Scholar]
- Walborn, N. R., Morrell, N. I., Howarth, I. D., et al. 2004, ApJ, 608, 1028 [NASA ADS] [CrossRef] [Google Scholar]
- Walborn, N. R., Howarth, I. D., Evans, C. J., et al. 2010, AJ, 139, 1283 [NASA ADS] [CrossRef] [Google Scholar]
- Walborn, N. R., Sana, H., Simón-Díaz, S., et al. 2014, A&A, 564, A40 [NASA ADS] [CrossRef] [EDP Sciences] [Google Scholar]
- Wang, B., Shi, W., & Miao, Z. 2015, PLoS ONE, 10, e0118537 [Google Scholar]
- Zickgraf, F. J., Kovacs, J., Wolf, B., et al. 1996, A&A, 309, 505 [Google Scholar]
The BONNSAI web-service is available at www.astro.unibonn.de/stars/bonnsai
All Tables
Spectral type-Teff (kK) calibration of OB stars in the XShootU sample together with previous results for OB stars in the LMC (Doran et al. 2013) and SMC (Dufton et al. 2019).
Comparison between fits to wind momenta of SMC and LMC OB stars according to Mokiem et al. (2007b) using optical spectroscopy with wind velocities largely estimated from vesc scaling relations, plus this study, for OB stars with dense winds (log Q ≥ −13.2), plus empirical wind velocities.
Comparison of physical and wind parameters of selected XShootU OB stars from this study with representative literature results based on optical diagnostics. All analyses involve FASTWIND (Puls et al. 2005; Rivero González et al. 2012) with the exception of Sk −71∘ 41 which used PoWR (Gräfener et al. 2002; Sander et al. 2015).
All Figures
|
Fig. 1 Overview of He and metal classification diagnostics for Galactic OB stars. Symbols are circles for luminosity classes V–IV, squares for III–II and triangles for I, filled for primary diagnostics, open for secondary diagnostics. Upper panel: Overview of He I–II and Si III–IV classification diagnostics for O and early B templates (Sota et al. 2011; Negueruela et al. 2024). Lower panel: As above, for Si II–IV and He I/Mg II classification diagnostics for B stars (restricted to supergiants for B2.5+), excluding B4, B6 subtypes for LMC stars (Fitzpatrick 1991). We also show the ratio of Si III λ4553 to Mg II λ4481 for B2–3 supergiants (green) since this is the qualitative diagnostic for SMC mid-B supergiants with B4, B6–7 excluded (Lennon 1997). |
| In the text | |
|
Fig. 2 Sequence of late O supergiant (Sk −71∘ 41, 09.5 Ib, this study), late O hypergiant (Sk −69∘ 279, ON9.5 Ia+, this study) and very late WN star (Sk −67∘ 266, WN11h, Crowther & Smith 1997) in the LMC, illustrating the transition from absorption line dominated stars to emission line dominated (e.g. He I λ4471, He II λ4686). Note that Balmer lines include nebular contributions for Sk −67∘ 266 (S61). |
| In the text | |
|
Fig. 3 Spectral types and luminosity classes of LMC (upper panel) and SMC (lower panel) ULLYSES OB stars based on XShootU spectral classifications, including archival VLT/Xshooter stars (blue: V–IV, green III–II, grey: I). |
| In the text | |
|
Fig. 4 Hα profiles of OeBe stars in the SMC (lower panel) and LMC (upper panel), excluded from our pipeline analysis. |
| In the text | |
|
Fig. 5 Histogram of radial velocities (in km s−1) of LMC (blue) and SMC (green) OB stars, from cross-correlation with synthetic template spectra. |
| In the text | |
|
Fig. 6 Pipeline temperatures (kK) versus XShootU spectral types for single + SB1 stars in the LMC (upper panel) and SMC (lower panel), colour coded by luminosity class: V (yellow pentagon), IV (cyan diamond), III (green square), II (blue triangle), I (red circle). We also include our calibration for dwarfs (solid yellow line), giants (dashed green line) and supergiants (dot-dashed red line). |
| In the text | |
|
Fig. 7 Hertzsprung-Russell diagram of XshootU sample (LMC: blue circles, SMC: green triangles), together with LMC evolutionary tracks for 10–200 M⊙ main-sequence stars from Brott et al. (2011) and Köhler et al. (2015). Evolutionary masses of post-main sequence stars are determined from TAMS luminosities of SMC tracks from Schootemeijer et al. (2019). |
| In the text | |
|
Fig. 8 Histogram of E(B – V) values for LMC (blue) and SMC (green) OB stars. |
| In the text | |
|
Fig. 9 Distribution of initial masses, Mini (in M⊙) of LMC (upper panel) and SMC (lower panel) ULLYSES OB stars (blue: V–IV, green III–II, grey: I), based on BONNSAI results using Brott et al. (2011) and Köhler et al. (2015) models for main sequence stars, or Schootemeijer et al. (2019) SMC evolutionary models for post-main sequence late B supergiants. |
| In the text | |
|
Fig. 10 Evolutionary versus spectroscopic masses (in M⊙) of LMC (blue) and SMC (green) OB stars, in which main sequence stars are circles/triangles and post-main sequence stars are squares/diamonds. Stars with unreliable surface gravities or uncertain stellar parameters are indicated with open symbols. The solid black line is a 1:1 relation, while dashed (dotted) black lines are fits to LMC (SMC) stars up to 60 M⊙. |
| In the text | |
|
Fig. 11 Pipeline results (LMC: blue circles, SMC: green triangles) presented in a spectroscopic HR diagram, with Teff in K, together with the Eddington limit for X = 73%, at |
| In the text | |
|
Fig. 12 Hydrogen (circles) and neutral helium (squares) ionizing photon rates (s−1) of LMC (blue) and SMC (green) OB stars, versus Teff. |
| In the text | |
|
Fig. 13 Histogram of projected rotational velocities ve sin i (km s−1) for LMC (blue) and SMC (green) OB stars, in 50 km s−1 bins aside from 0 bin i.e. 50 refers to 50 ± 25 km s−1. There are few rapid rotators amongst the XShootU sample. |
| In the text | |
|
Fig. 14 Projected ve sin i (km s−1) versus He mass fractions for LMC (blue) and SMC (green) main sequence and post-main sequence stars. |
| In the text | |
|
Fig. 15 Comparison between pipeline temperatures (kK) and empirical wind velocities, v∞, obtained either from SEI fits (quality i or ii filled symbols; quality iii open symbols) or vblack (open symbols) for OB dwarfs (blue circles), giants (red squares) and supergiants (black triangles), for the LMC (upper panel) and SMC (lower panel) together with the v∞ − Teff calibration from Hawcroft et al. (2024, solid black line). |
| In the text | |
|
Fig. 16 Temperature dependence of v∞/vesc for LMC (SMC) main sequence stars shown as blue circles (green triangles) and post-main sequence stars shown as blue squares (green diamonds), together with the Lamers et al. (1995) relation for Milky Way stars. v∞/vesc ≪ 1 for a sizeable subset of (mostly) SMC OB stars. |
| In the text | |
|
Fig. 17 Inferred mass-loss rates of LMC (blue circles) and SMC (green triangles) OB stars versus luminosity, in which stars with weak winds (log Q ≤ −13.2) or uncertain stellar parameters are indicated with open symbols. |
| In the text | |
|
Fig. 18 (Reduced) wind momentum versus luminosity results for LMC (blue circles) and SMC (green triangles) OB (upper panel), O (middle panel) and B (lower panel) stars. Wind velocities lacking empirical results are obtained from the calibration of Hawcroft et al. (2024). Stars with weak winds (log Q ≤ −13.2) or uncertain stellar parameters are indicated with open symbols. |
| In the text | |
|
Fig. 19 Comparison between pipeline-derived Teff and ΔTeff/Teff (upper panel), Δ log g (middle panel), Δ log L/L⊙ (lower panel) from detailed XShootU analyses of OB stars using FASTWIND (black), CMFGEN (red) and PoWR (blue). Positive values indicate higher quantities from pipeline. Open symbols are suspected binaries according to Backs et al. (2024) and Brands et al. (2024). |
| In the text | |
Current usage metrics show cumulative count of Article Views (full-text article views including HTML views, PDF and ePub downloads, according to the available data) and Abstracts Views on Vision4Press platform.
Data correspond to usage on the plateform after 2015. The current usage metrics is available 48-96 hours after online publication and is updated daily on week days.
Initial download of the metrics may take a while.