Fig. 15
Download original image
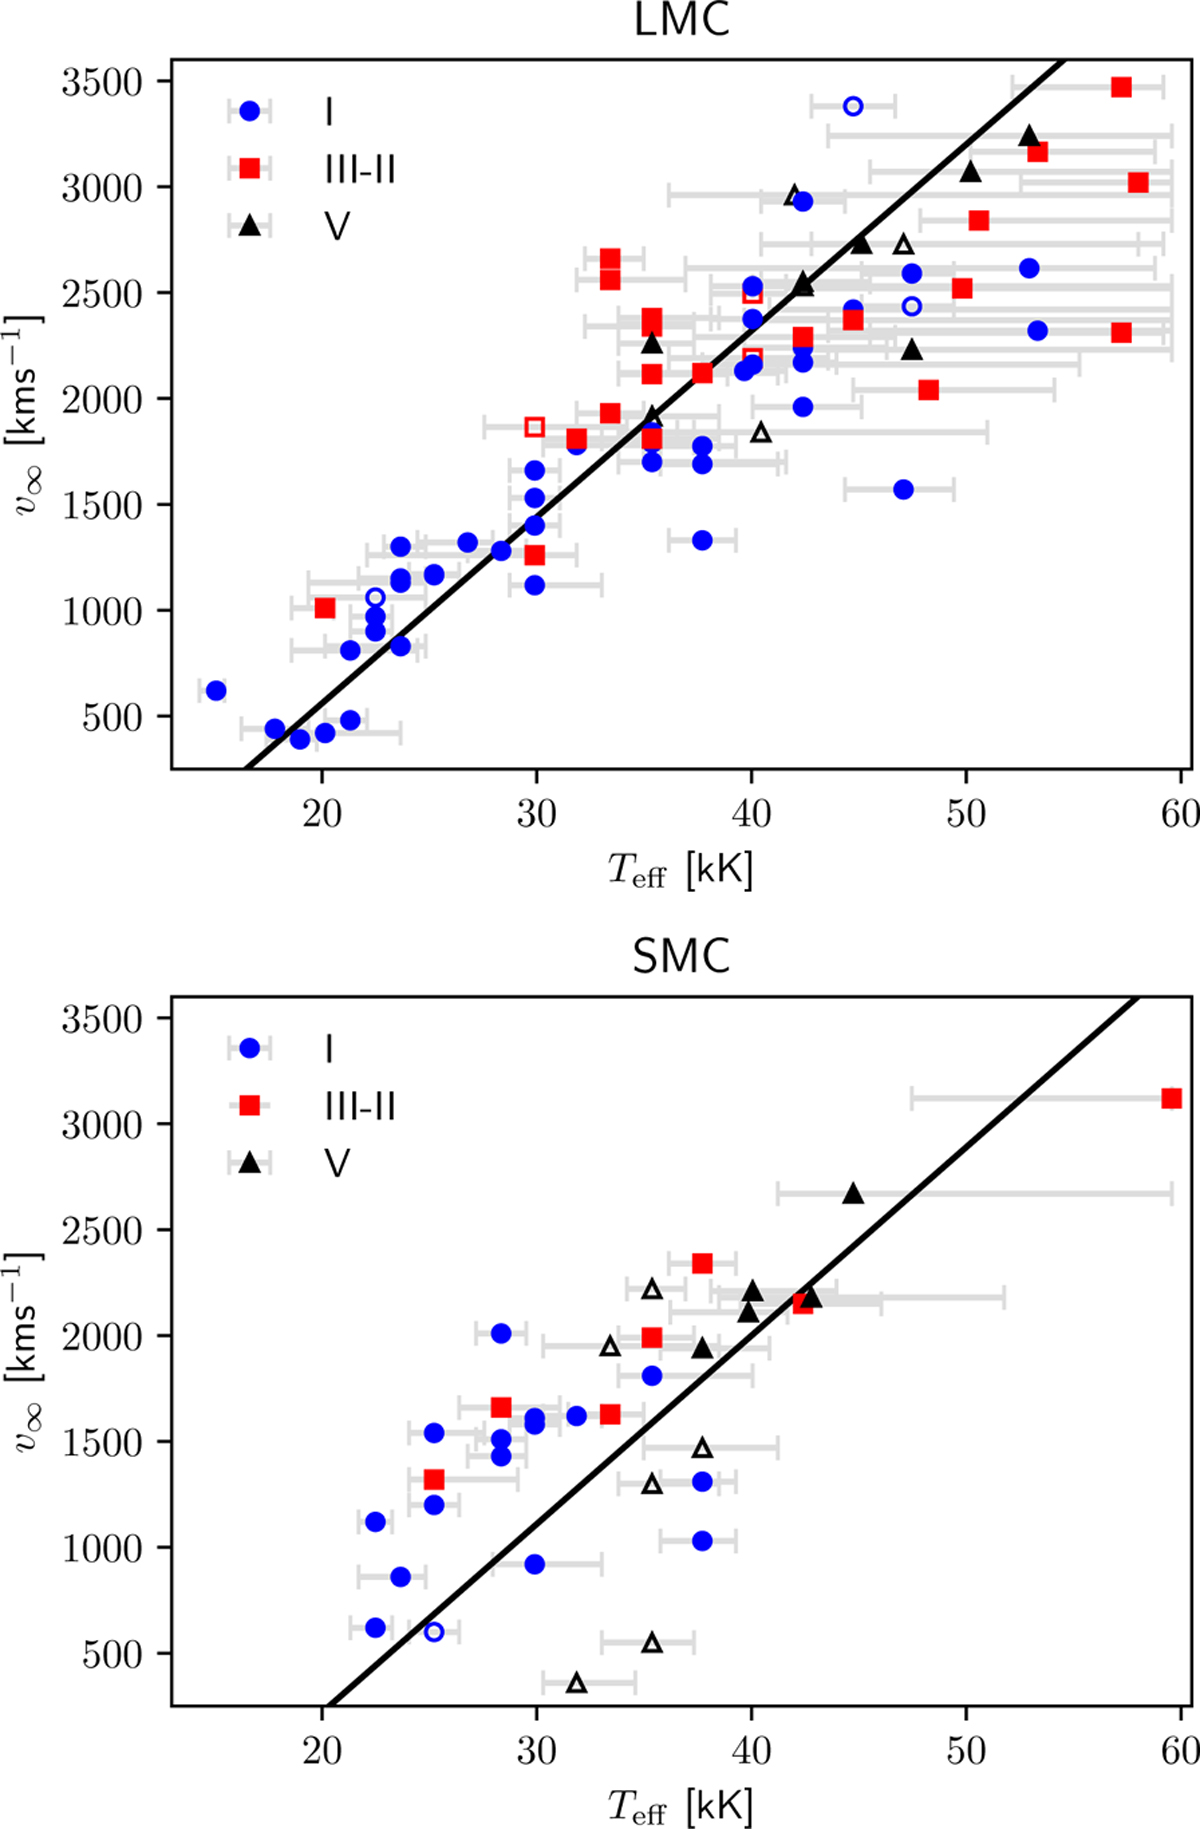
Comparison between pipeline temperatures (kK) and empirical wind velocities, v∞, obtained either from SEI fits (quality i or ii filled symbols; quality iii open symbols) or vblack (open symbols) for OB dwarfs (blue circles), giants (red squares) and supergiants (black triangles), for the LMC (upper panel) and SMC (lower panel) together with the v∞ − Teff calibration from Hawcroft et al. (2024, solid black line).
Current usage metrics show cumulative count of Article Views (full-text article views including HTML views, PDF and ePub downloads, according to the available data) and Abstracts Views on Vision4Press platform.
Data correspond to usage on the plateform after 2015. The current usage metrics is available 48-96 hours after online publication and is updated daily on week days.
Initial download of the metrics may take a while.