Table 1.
ML logarithmic mass and concentration of the NFW fit to average cluster lensing profiles, and associated reduced χ2.
| Data Set | log M⟨ΔΣ⟩ | log c⟨ΔΣ⟩ | χred2 |
|---|---|---|---|
| LSS + shape noise (Sect. 4) | 13.992 ± 0.004 | 0.509 ± 0.016 | 6.51 |
| 14.927 ± 0.012 | 0.437 ± 0.025 | 1.36 | |
| Three Hundred (ECG) | 14.914 ± 0.026 | 0.671 ± 0.033 | 0.43 |
| photo-z non-conservative (Sect. 5.1.1) | 13.895 ± 0.005 | 0.467 ± 0.017 | 6.30 |
| 14.858 ± 0.012 | 0.423 ± 0.027 | 1.24 | |
| photo-z robust (Sect. 5.1.2) | 13.994 ± 0.005 | 0.509 ± 0.020 | 3.82 |
| 14.935 ± 0.014 | 0.445 ± 0.032 | 0.80 | |
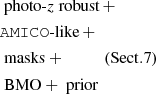
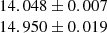
| AMICO-like (Sect. 5.2) | 14.015 ± 0.005 | 0.436 ± 0.016 | 8.49 |
| 14.927 ± 0.014 | 0.420 ± 0.027 | 2.74 | |
| PZWav-like (Sect. 5.2) | 13.996 ± 0.005 | 0.454 ± 0.016 | 4.49 |
| 14.892 ± 0.013 | 0.425 ± 0.027 | 2.05 | |
| masks (Sect. 5.3) | 13.997 ± 0.005 | 0.502 ± 0.018 | 5.64 |
| 14.919 ± 0.013 | 0.445 ± 0.029 | 1.80 | |
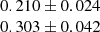
| BMO (Sect. 6.1) | 14.013 ± 0.004 | 0.309 ± 0.018 | 1.43 |
| 14.927 ± 0.012 | 0.369 ± 0.031 | 0.68 | |
 |
 |
 |
 |
Notes. Reported uncertainties are the standard deviation of the marginalised distribution. For each data set, lensing average quantities are shown for the full mass range (top row), or log Msim ≥ 14.7 (bottom row).
Current usage metrics show cumulative count of Article Views (full-text article views including HTML views, PDF and ePub downloads, according to the available data) and Abstracts Views on Vision4Press platform.
Data correspond to usage on the plateform after 2015. The current usage metrics is available 48-96 hours after online publication and is updated daily on week days.
Initial download of the metrics may take a while.