Open Access
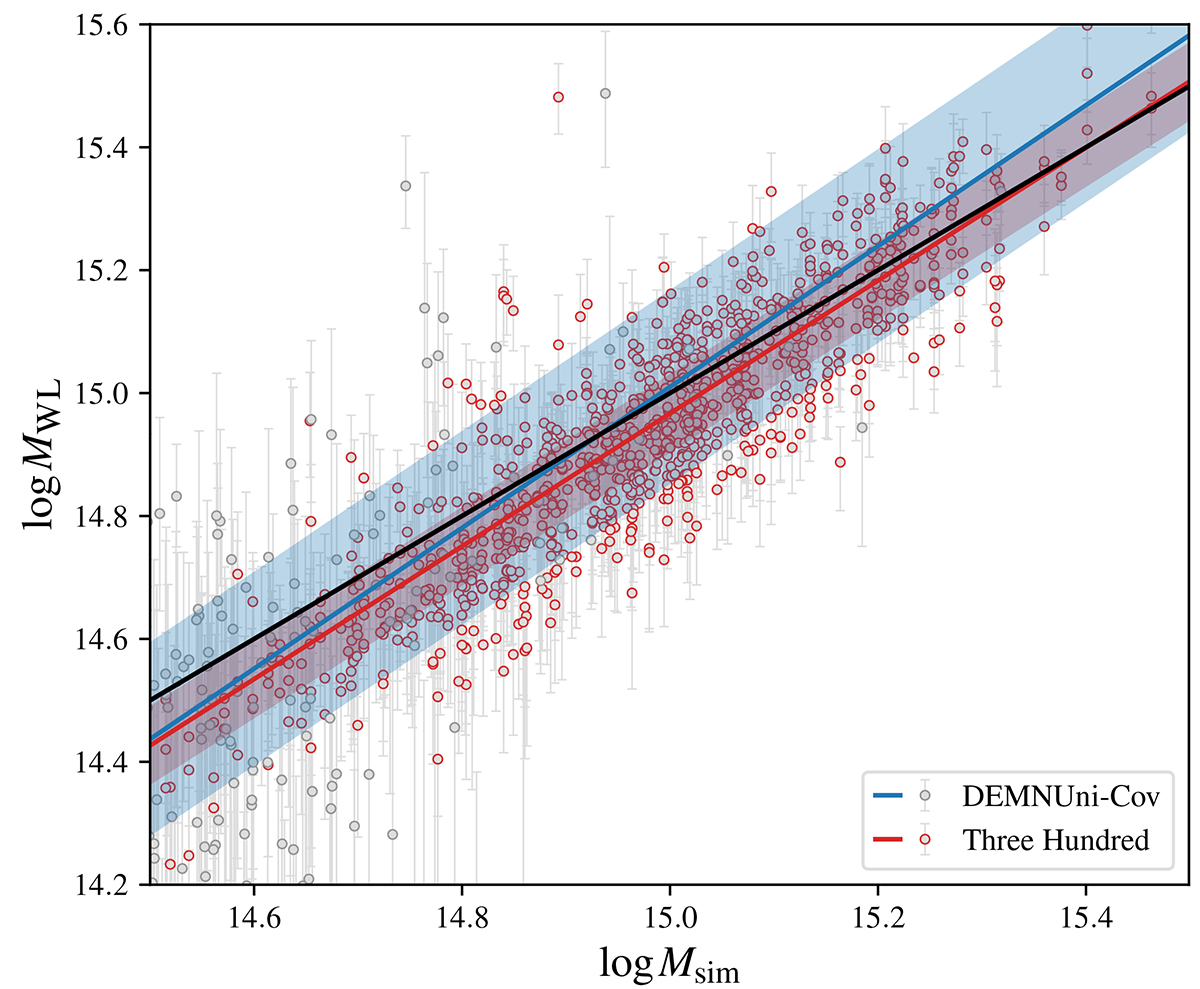
Fig. 7.
Download original image
Scatter plot for median WL mass point estimates of DEMNUni-Cov clusters in the ECG mass range. Error bars correspond to the 16th and 84th percentiles. The red line shows the linear regression for median WL mass measured in ECG. The shaded region corresponds to the scatter.
Current usage metrics show cumulative count of Article Views (full-text article views including HTML views, PDF and ePub downloads, according to the available data) and Abstracts Views on Vision4Press platform.
Data correspond to usage on the plateform after 2015. The current usage metrics is available 48-96 hours after online publication and is updated daily on week days.
Initial download of the metrics may take a while.