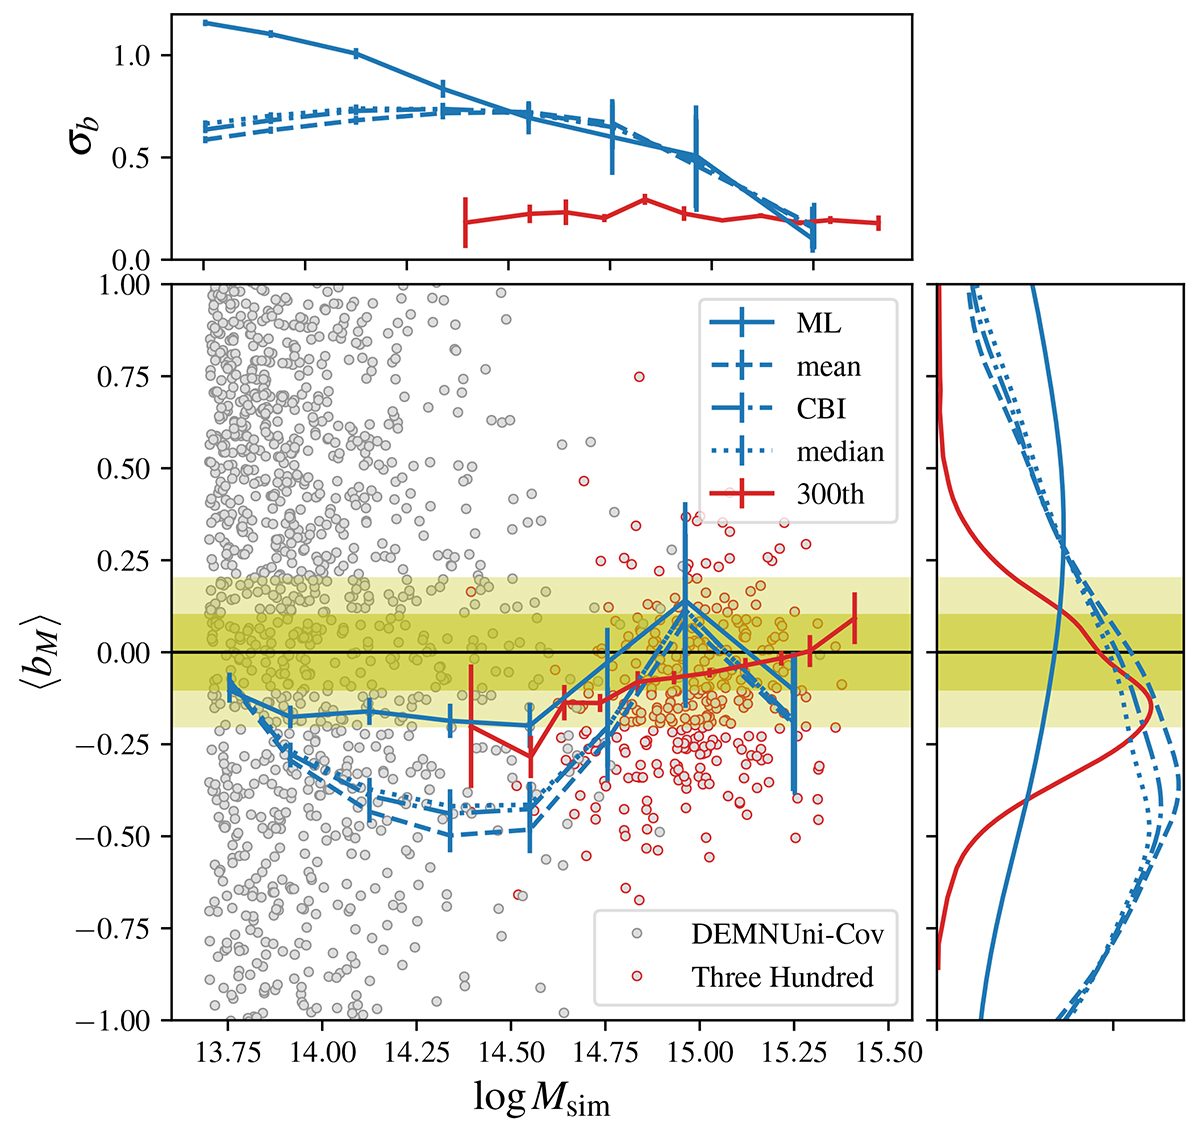
Fig. 5.
Download original image
Weighted average (plotted as lines) of the WL mass bias for median, CBI, mean, and ML point estimates as a function of the true mass of the DEMNUni-Cov clusters. The grey points show the WL mass bias for ML estimates. Results from ECG are presented with red lines and points. The light and dark yellow bands mark ±10% and 20% thresholds, respectively. Top and right panels give the mass bias scatter and the distribution of the mass bias points for each estimator, respectively. Error bars are the standard deviation of the bootstrap sample distribution of weighted means.
Current usage metrics show cumulative count of Article Views (full-text article views including HTML views, PDF and ePub downloads, according to the available data) and Abstracts Views on Vision4Press platform.
Data correspond to usage on the plateform after 2015. The current usage metrics is available 48-96 hours after online publication and is updated daily on week days.
Initial download of the metrics may take a while.