Open Access
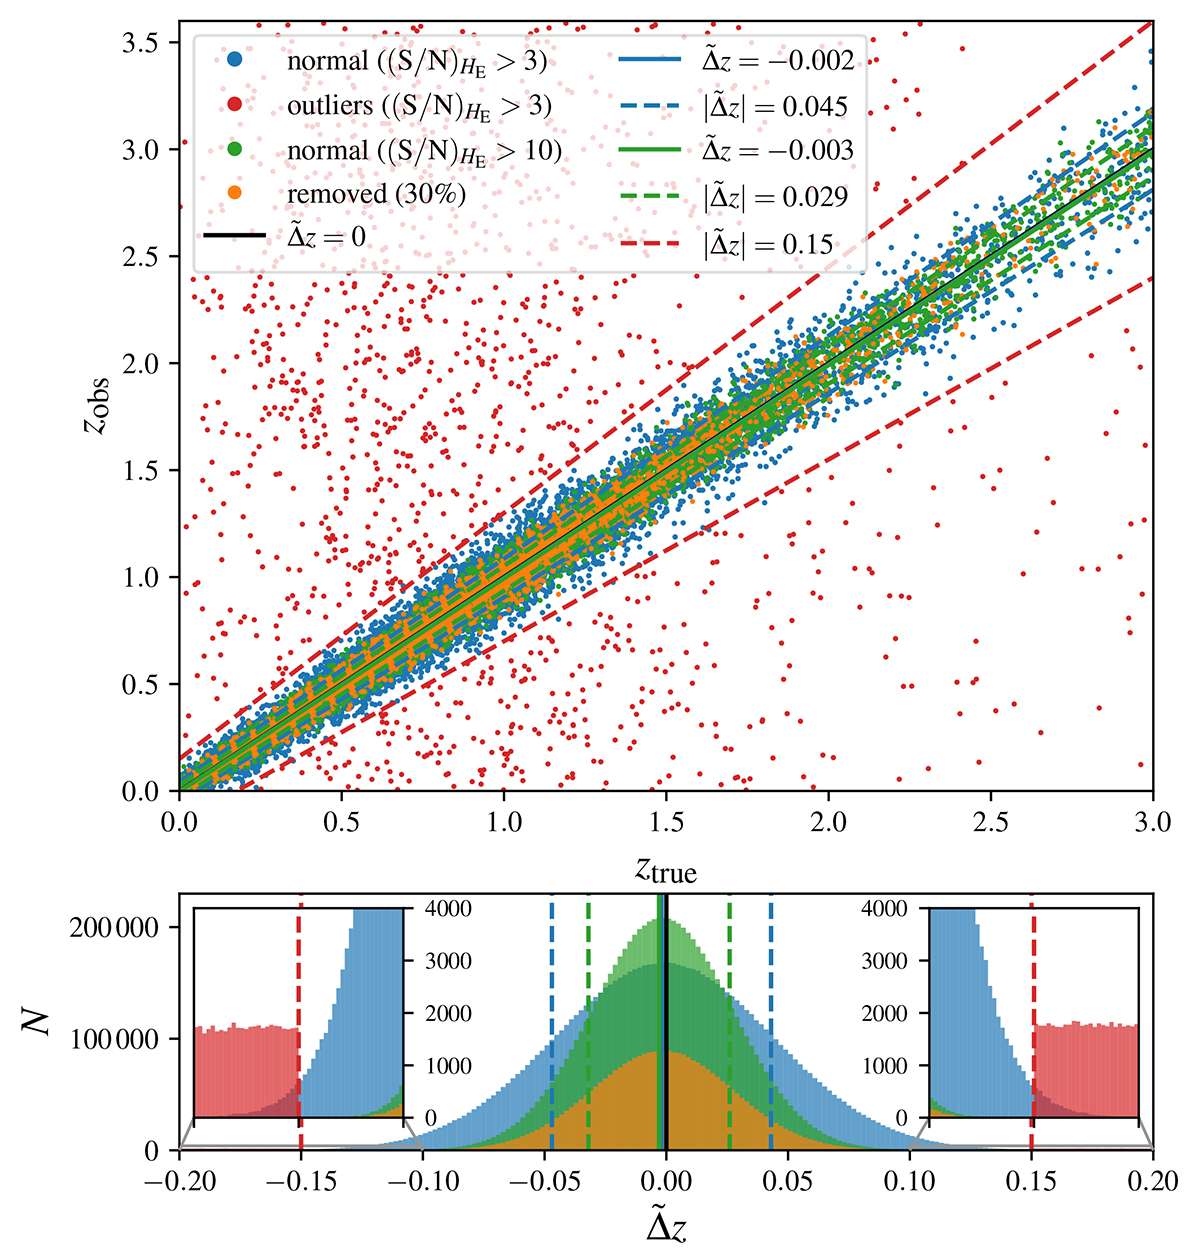
Fig. 10.
Download original image
Scatter plot of simulated photo-z vs. true redshift for non-conservative (red + blue) or robust (green − orange) selection. The bottom panel shows the marginalised 1D distribution of the normalised redshift deviation.
Current usage metrics show cumulative count of Article Views (full-text article views including HTML views, PDF and ePub downloads, according to the available data) and Abstracts Views on Vision4Press platform.
Data correspond to usage on the plateform after 2015. The current usage metrics is available 48-96 hours after online publication and is updated daily on week days.
Initial download of the metrics may take a while.