Fig. 1.
Download original image
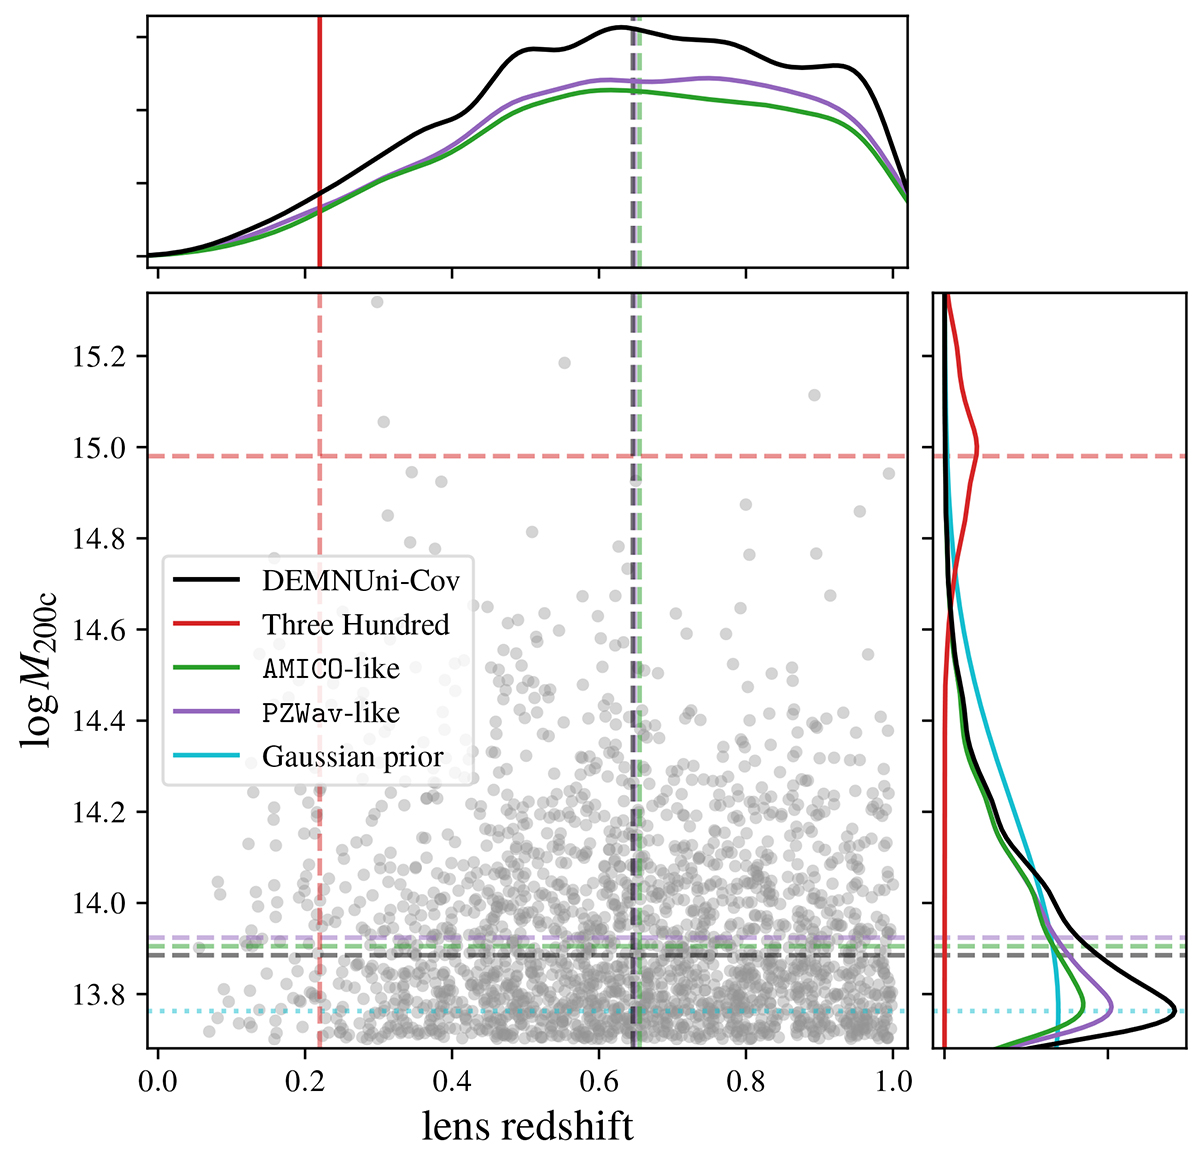
Distribution of the DEMNUni-Cov clusters and of the Three Hundred clusters (ECG) in the mass-redshift plane. The marginalised distribution of the redshift and mass of the clusters is shown in the top and right panels, respectively. Distributions are normalised to the full DEMNUni-Cov sample. Distributions of AMICO and PZWav-like selected objects (see Sect. 5.2) are also shown. The median is shown with dashed lines. The mean of the Gaussian prior on mass (see Sect. 6.2) is shown on the right panel as a dotted line.
Current usage metrics show cumulative count of Article Views (full-text article views including HTML views, PDF and ePub downloads, according to the available data) and Abstracts Views on Vision4Press platform.
Data correspond to usage on the plateform after 2015. The current usage metrics is available 48-96 hours after online publication and is updated daily on week days.
Initial download of the metrics may take a while.