Fig. 2.
Download original image
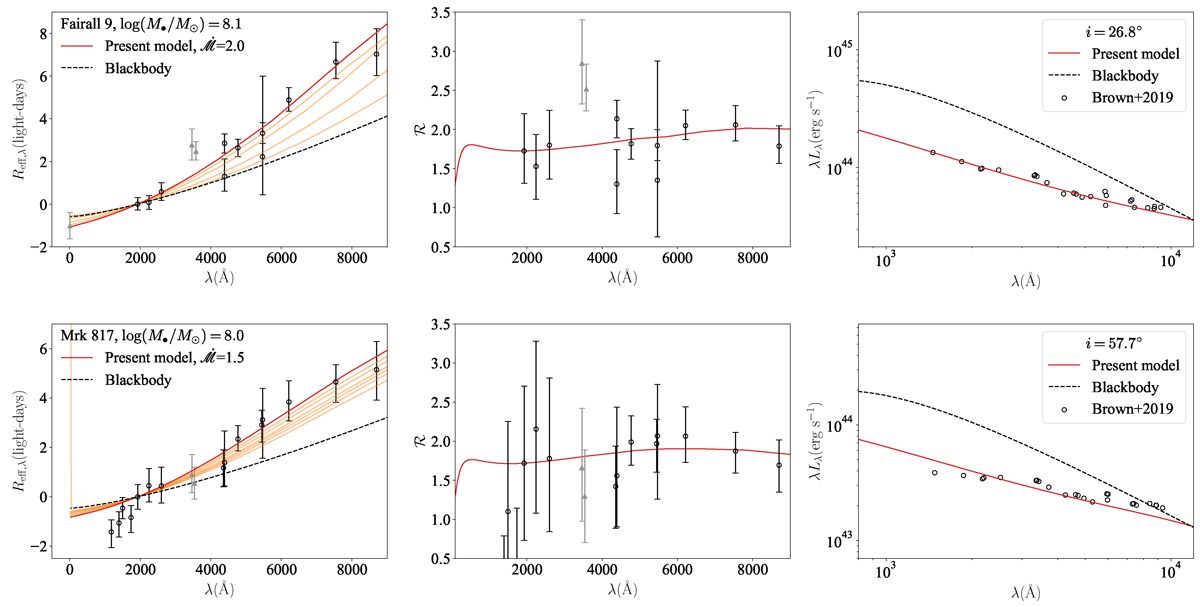
Effective radii, effective radius ratios and SEDs for mapped AGNs. Left panels show Reff as a function of wavelength predicted by the current model for different preset accretion rates, in orange, while the red lines correspond to the best-fit ![]() determined by minimizing χ2. The error bars represent the observational results with references listed in Table 1. Data points with triangle markers are the observational data excluded in fitting. The dashed lines show effective radii predicted by the canonical blackbody model using the best-fit
determined by minimizing χ2. The error bars represent the observational results with references listed in Table 1. Data points with triangle markers are the observational data excluded in fitting. The dashed lines show effective radii predicted by the canonical blackbody model using the best-fit ![]() . The middle panels show the ℛ predicted by the current model, the error bars represent observational data while the red lines are the model predictions. Right panels are the SEDs in which the red lines represent SEDs predicted by the current model, while the dashed lines indicate SEDs from canonical blackbody cases. The circle points and error bars are the observational data of SEDs with references listed in Table 1. For results on the rest of the objects, see Appendix B.
. The middle panels show the ℛ predicted by the current model, the error bars represent observational data while the red lines are the model predictions. Right panels are the SEDs in which the red lines represent SEDs predicted by the current model, while the dashed lines indicate SEDs from canonical blackbody cases. The circle points and error bars are the observational data of SEDs with references listed in Table 1. For results on the rest of the objects, see Appendix B.
Current usage metrics show cumulative count of Article Views (full-text article views including HTML views, PDF and ePub downloads, according to the available data) and Abstracts Views on Vision4Press platform.
Data correspond to usage on the plateform after 2015. The current usage metrics is available 48-96 hours after online publication and is updated daily on week days.
Initial download of the metrics may take a while.