Fig. 1
Download original image
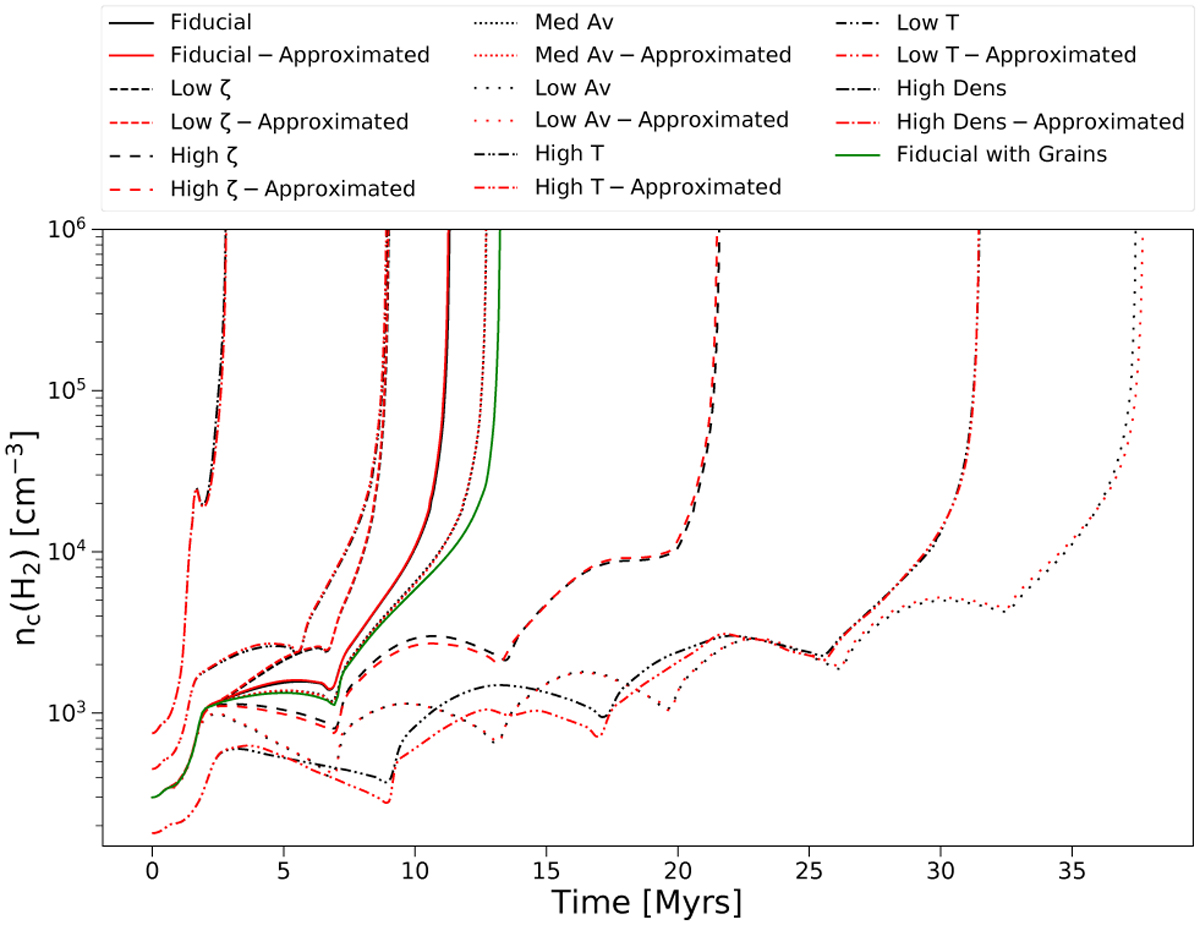
Comparisons of the time evolution of the central H2 number density for models used in the interpolation. The black lines represent simulations using a full chemical network, and the red lines represent simulations using our approximate method. Different line styles are used to denote models with different physical parameters (see legend). The green line represents a model with the same physical parameters as the fiducial model, which also includes the effects of grains. Different physical conditions have a more drastic effect on the evolution of the cloud than the inclusion of grains.
Current usage metrics show cumulative count of Article Views (full-text article views including HTML views, PDF and ePub downloads, according to the available data) and Abstracts Views on Vision4Press platform.
Data correspond to usage on the plateform after 2015. The current usage metrics is available 48-96 hours after online publication and is updated daily on week days.
Initial download of the metrics may take a while.