Fig. 6.
Download original image
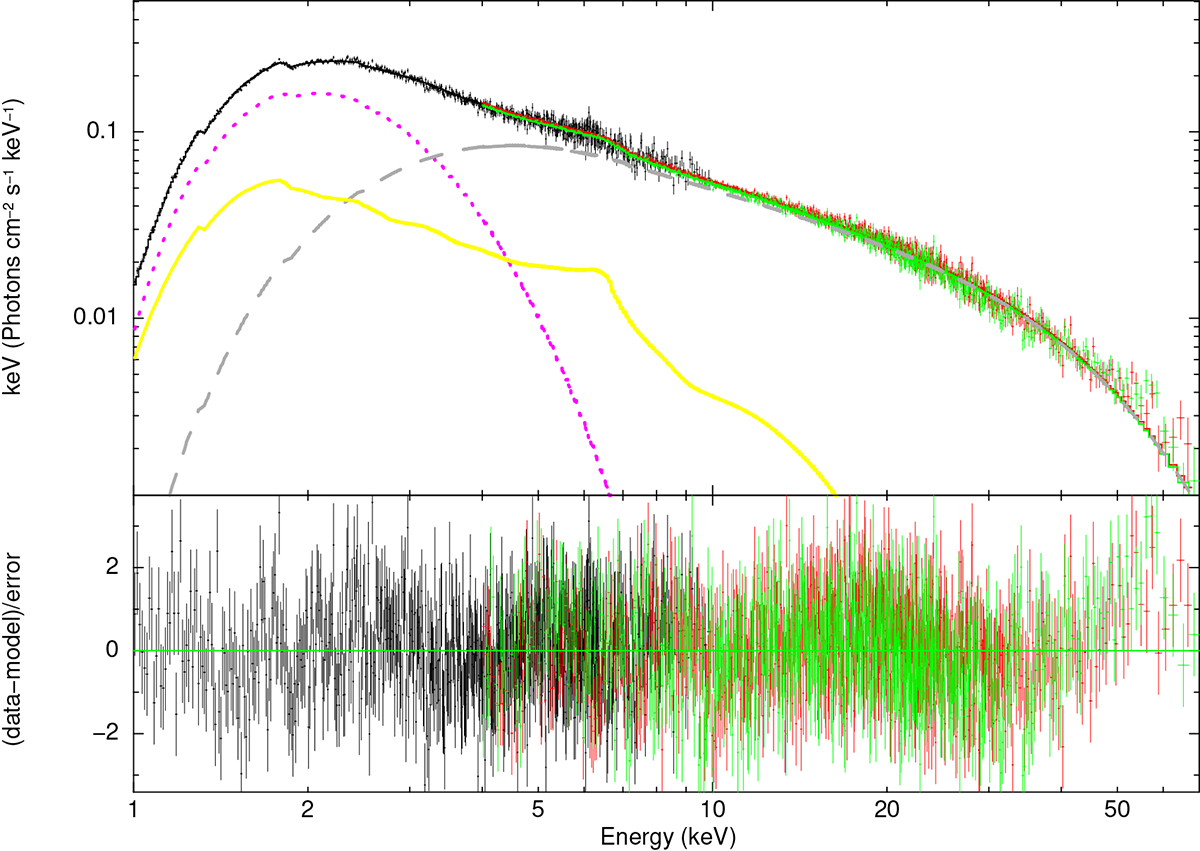
Best-fitting results with the reflection model M5 for NICER/NuSTAR observation of MAXI J1816–195. We show the fitted spectra and the individual model components (main panel), and the residuals in terms of sigmas (subpanel) in the plots. The components diskbb, compTT, and relxillns are plotted with the dotted purple line, the dashed gray line, and the solid yellow line, respectively.
Current usage metrics show cumulative count of Article Views (full-text article views including HTML views, PDF and ePub downloads, according to the available data) and Abstracts Views on Vision4Press platform.
Data correspond to usage on the plateform after 2015. The current usage metrics is available 48-96 hours after online publication and is updated daily on week days.
Initial download of the metrics may take a while.