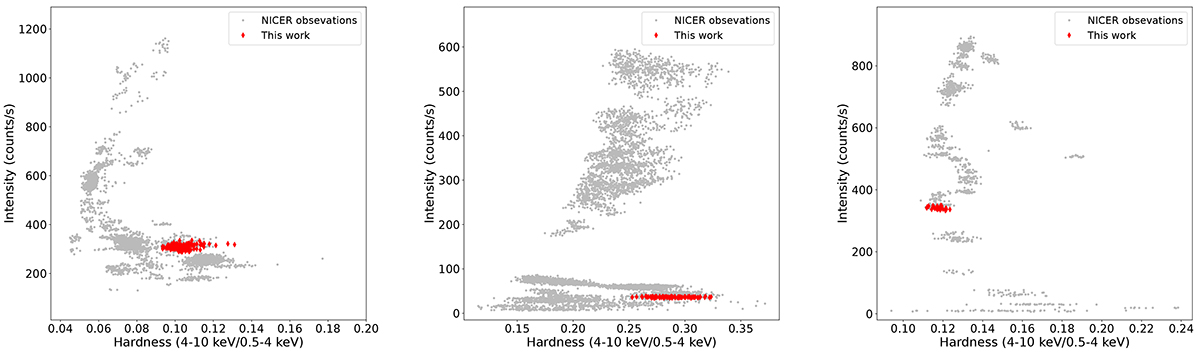
Fig. 2.
Download original image
Hardness-intensity diagram of NICER observations of 4U 1636–53 (left), XTE J1739–285 (middle), and MAXI J1816–195 (right). The hardness ratio is defined as the count ratio of the 4–10 and 0.5–4 keV, and the intensity is defined as the counts in 0.5–10 keV. Each datapoint in the plots corresponds to a 64-second NICER data segment, with the NICER observations analyzed in this work shown in red and other NICER observations marked in gray.
Current usage metrics show cumulative count of Article Views (full-text article views including HTML views, PDF and ePub downloads, according to the available data) and Abstracts Views on Vision4Press platform.
Data correspond to usage on the plateform after 2015. The current usage metrics is available 48-96 hours after online publication and is updated daily on week days.
Initial download of the metrics may take a while.