Fig. 7.
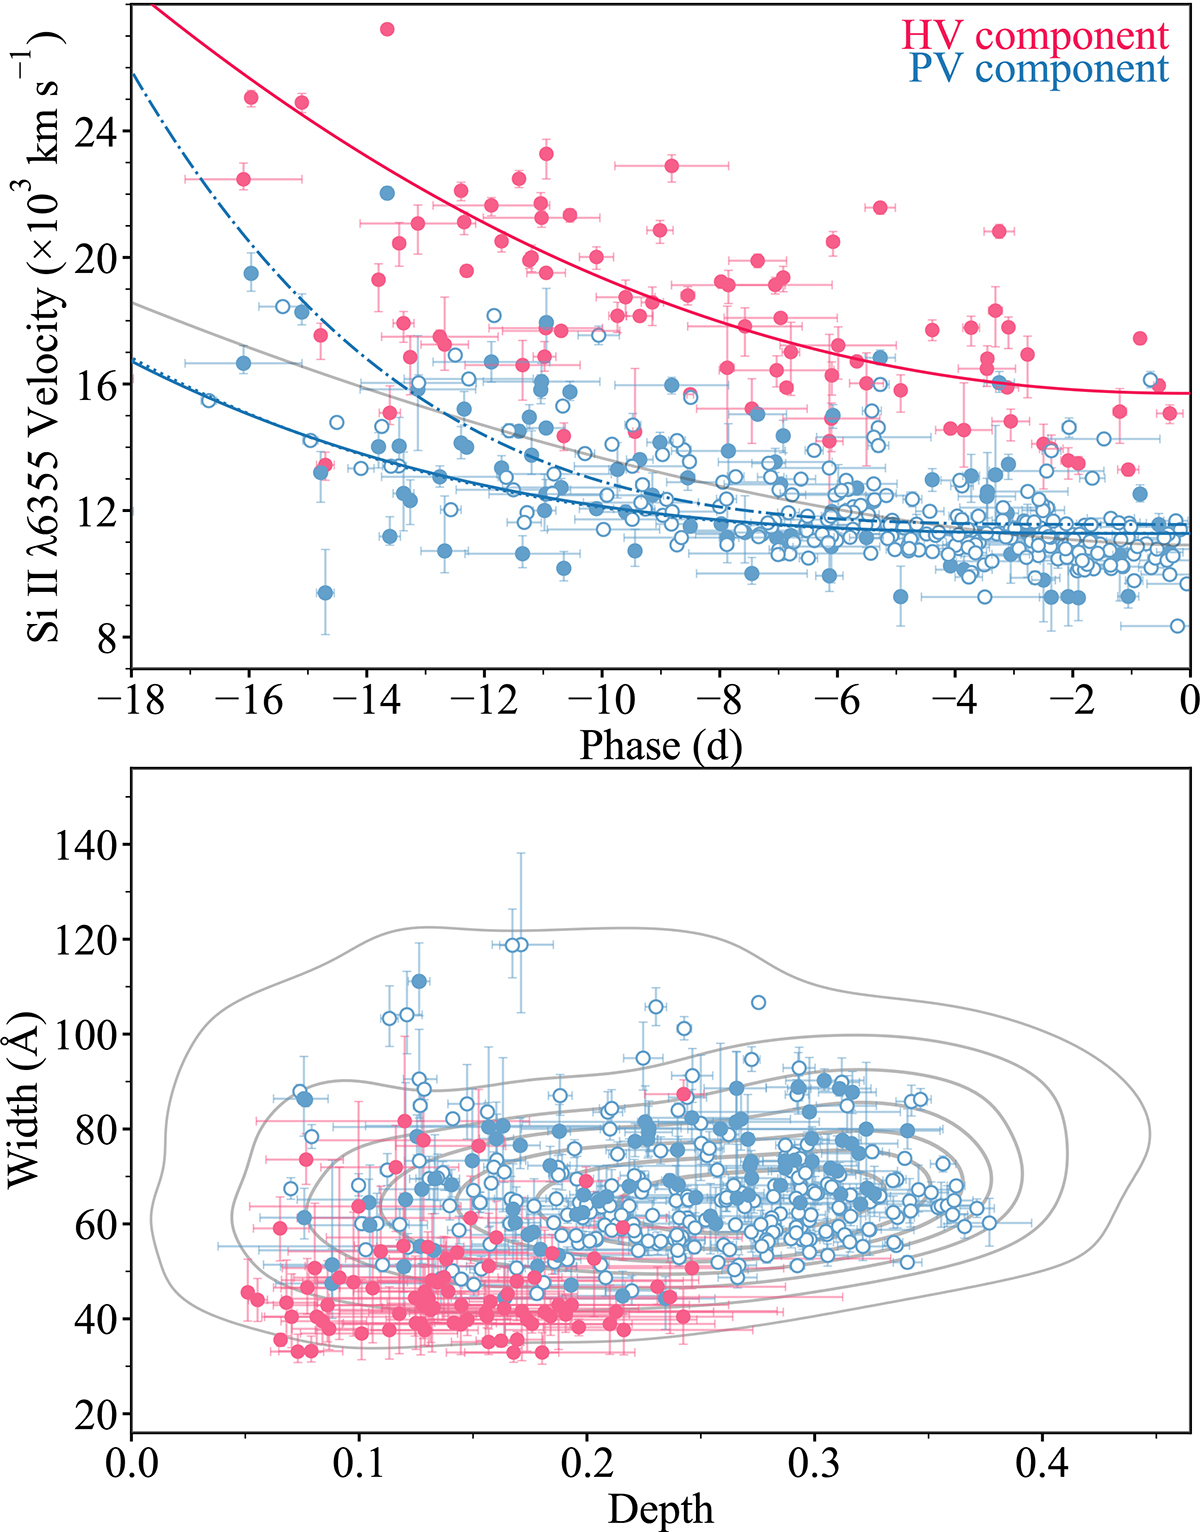
Download original image
Evolution of the velocities of the PV and HV Si IIλ6355 components for all 329 spectra in the sample (top panel). The hollow points correspond to the 244 PV components with no HV counterpart. The solid blue line is fit to all the PV components, with the dash-dotted and dotted blue lines showing fits to the PV components of spectra with and without HV components, respectively. The pink line is the fit to the HV components and the grey line is the evolution from the PTF sample (Maguire et al. 2014). The width against depth for the measured PV and HV Si IIλ6355 components using the same colours as the top panel (bottom panel). The grey contours show the KDE for the PTF sample for comparison.
Current usage metrics show cumulative count of Article Views (full-text article views including HTML views, PDF and ePub downloads, according to the available data) and Abstracts Views on Vision4Press platform.
Data correspond to usage on the plateform after 2015. The current usage metrics is available 48-96 hours after online publication and is updated daily on week days.
Initial download of the metrics may take a while.