Fig. 6.
Download original image
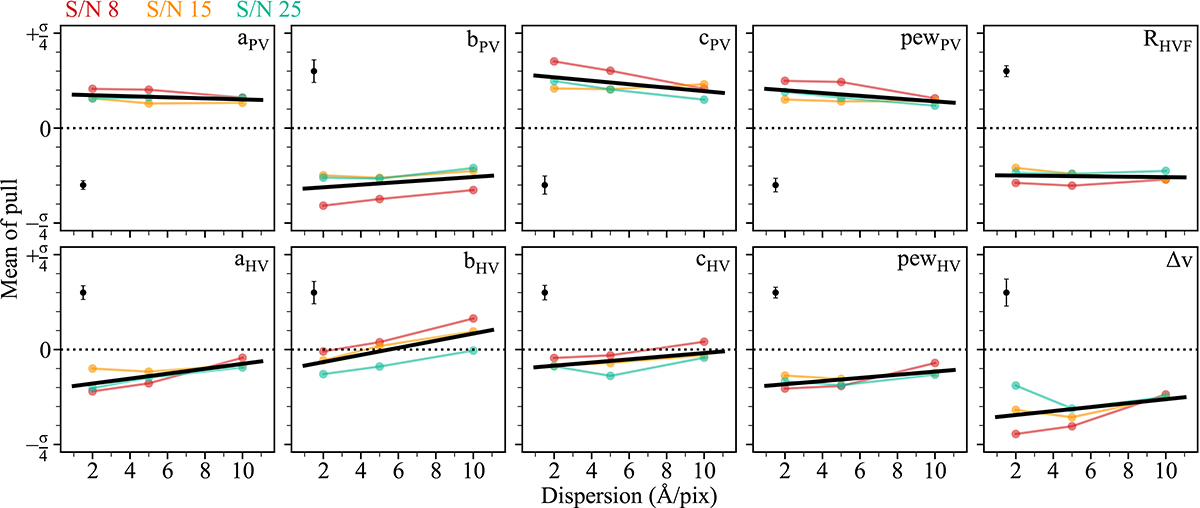
Means of the pull distributions for each of the simulations after applying the uncertainty corrections. The formatting matches that of Fig 5. The thick black lines present linear regressions to these trends that can be used to characterise and then correct for the biases. The black point in each panel presents the standard deviation of the points around this fit.
Current usage metrics show cumulative count of Article Views (full-text article views including HTML views, PDF and ePub downloads, according to the available data) and Abstracts Views on Vision4Press platform.
Data correspond to usage on the plateform after 2015. The current usage metrics is available 48-96 hours after online publication and is updated daily on week days.
Initial download of the metrics may take a while.