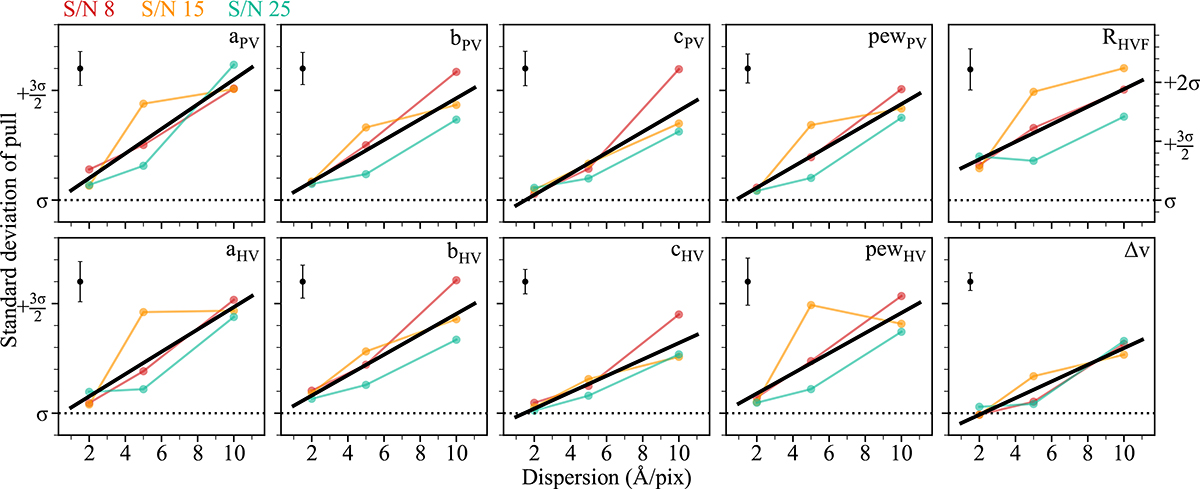
Fig. 5.
Download original image
Standard deviations of the pull distributions about their means for each of the simulations. The three S/Ns are represented by different colours, as indicated above the top-left panel. The thick solid lines describe the linear regression fits to the data points with each of the three dispersions. The black point in each panel presents the standard deviation of the points around this fit. We highlight that the RHVF panel has a different y-axis scaling due to the larger standard deviation values.
Current usage metrics show cumulative count of Article Views (full-text article views including HTML views, PDF and ePub downloads, according to the available data) and Abstracts Views on Vision4Press platform.
Data correspond to usage on the plateform after 2015. The current usage metrics is available 48-96 hours after online publication and is updated daily on week days.
Initial download of the metrics may take a while.