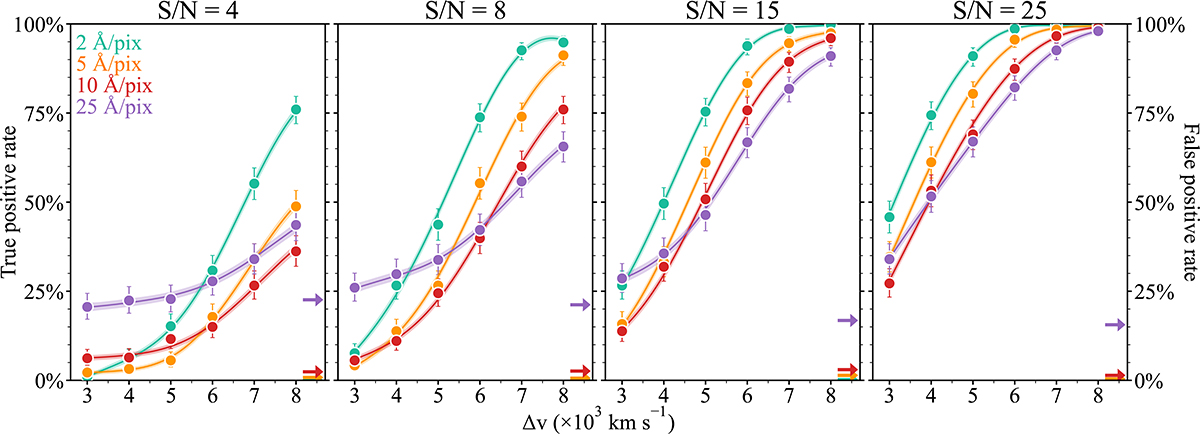
Fig. 3.
Download original image
True (circles) and false (arrows) positive rates of the MCMC/BIC classification method as a function of the velocity separations derived from the simulations for increasing S/Ns (from left to right in the panels) and different spectral dispersions (shown as different colours). One-dimensional slices (in Δv space) of the 3D GP interpolation of S/N, dispersion, and velocity separation are presented as the coloured lines and associated 68% confidence interval regions.
Current usage metrics show cumulative count of Article Views (full-text article views including HTML views, PDF and ePub downloads, according to the available data) and Abstracts Views on Vision4Press platform.
Data correspond to usage on the plateform after 2015. The current usage metrics is available 48-96 hours after online publication and is updated daily on week days.
Initial download of the metrics may take a while.