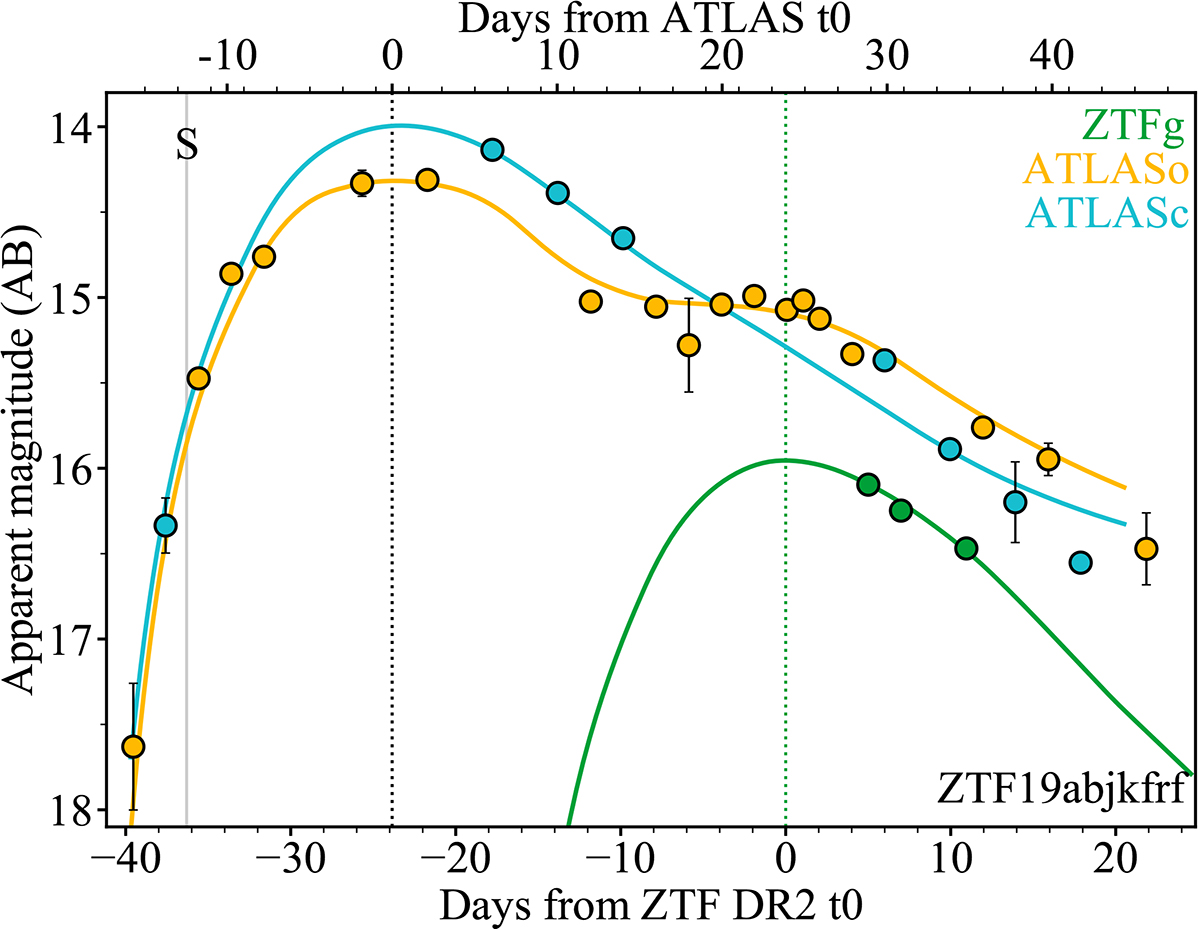
Fig. A.1.
Download original image
An example of a SALT2 fit to a DR2 g-band light curve of ZTF19abjkfrf, which results in a poor spectral phase estimate due to low coverage and single-band data. The original SALT2 fit is shown in green with the updated fit to the supplementary data from ATLAS in the cyan (ATLASc) and orange (ATLASo) filters displayed by the cyan and orange curves. The spectral date is represented by the solid grey vertical line, with the dotted vertical lines corresponding to the original (green) and updated (black) maximum light fit measurements.
Current usage metrics show cumulative count of Article Views (full-text article views including HTML views, PDF and ePub downloads, according to the available data) and Abstracts Views on Vision4Press platform.
Data correspond to usage on the plateform after 2015. The current usage metrics is available 48-96 hours after online publication and is updated daily on week days.
Initial download of the metrics may take a while.