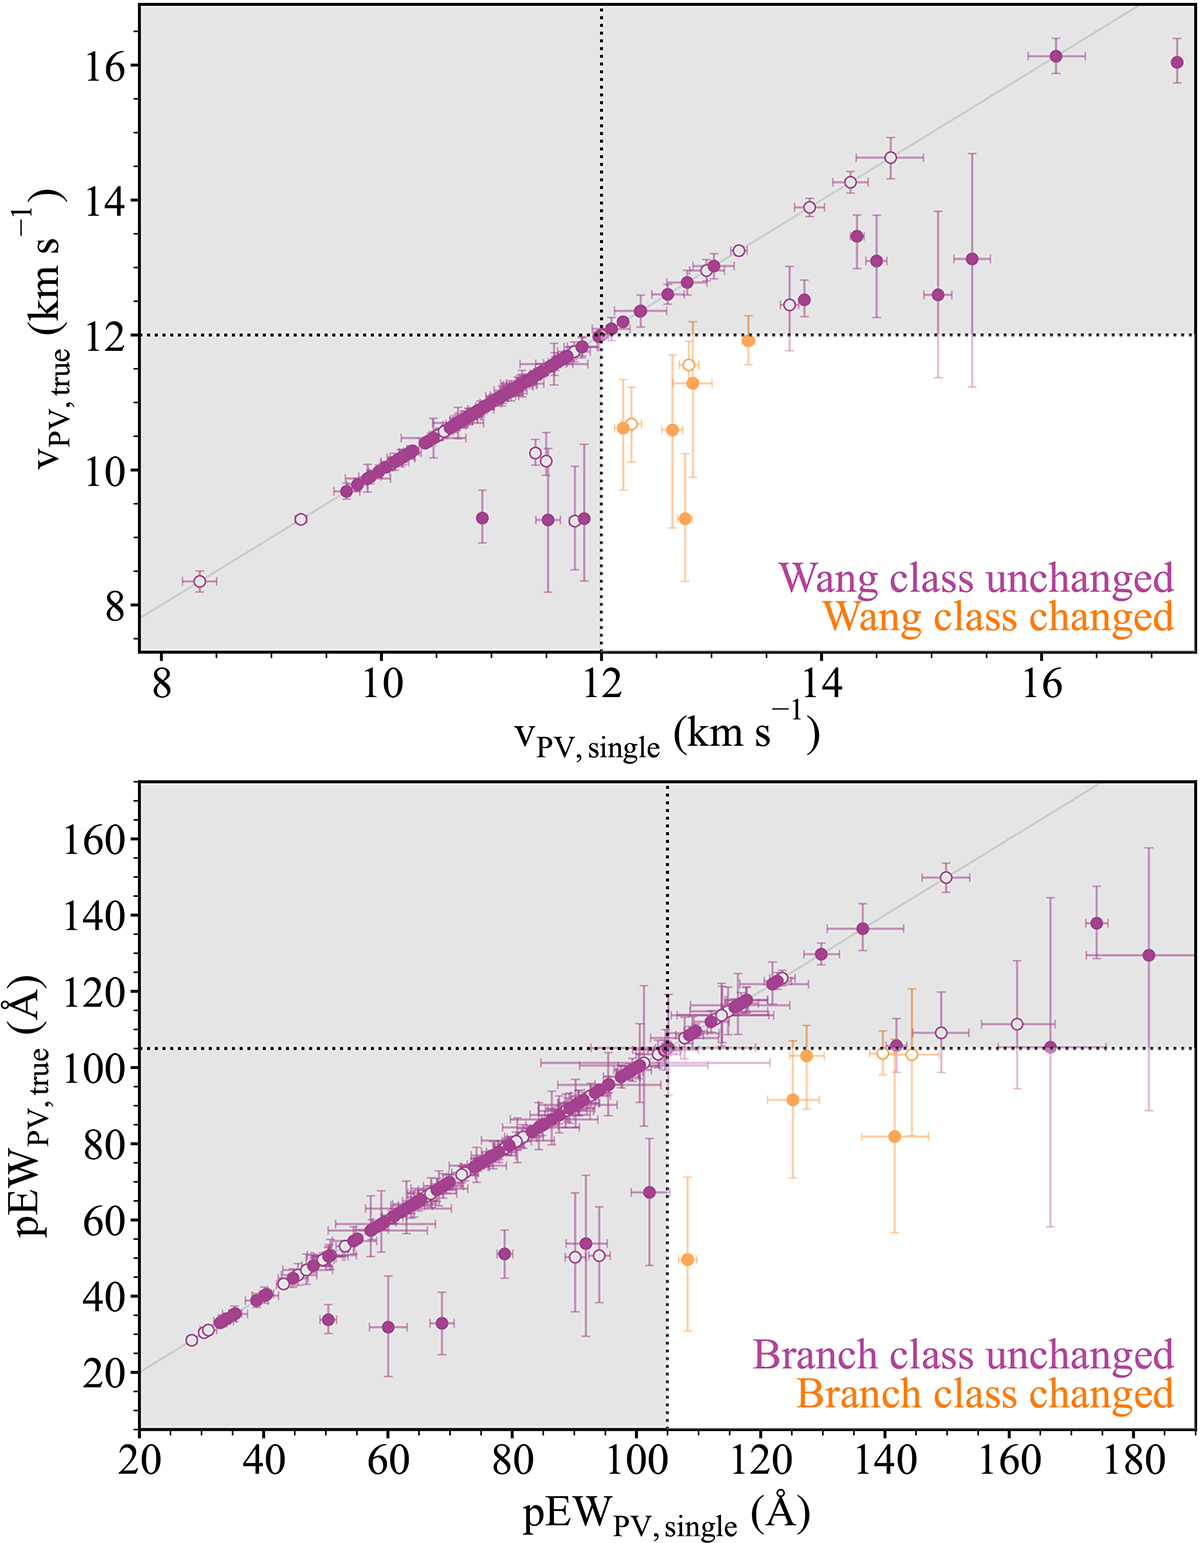
Fig. 16.
Download original image
Comparison of the photospheric velocity (top) and pEW (bottom) measured using the single component fits against taking into consideration the HV components and using the two component fits wherever an HV component was identified. Solid data points represent the low-bias sample, with hollow data points corresponding to the remaining objects from the full sample with z > 0.06. The points indicated in orange would be misclassified in the Wang scheme and Branch scheme in the top and bottom panels respectively, if the HV components were not to be considered. These two classification schemes concern spectra around maximum light, and as such, all the spectra presented here have phases greater that –5 d.
Current usage metrics show cumulative count of Article Views (full-text article views including HTML views, PDF and ePub downloads, according to the available data) and Abstracts Views on Vision4Press platform.
Data correspond to usage on the plateform after 2015. The current usage metrics is available 48-96 hours after online publication and is updated daily on week days.
Initial download of the metrics may take a while.