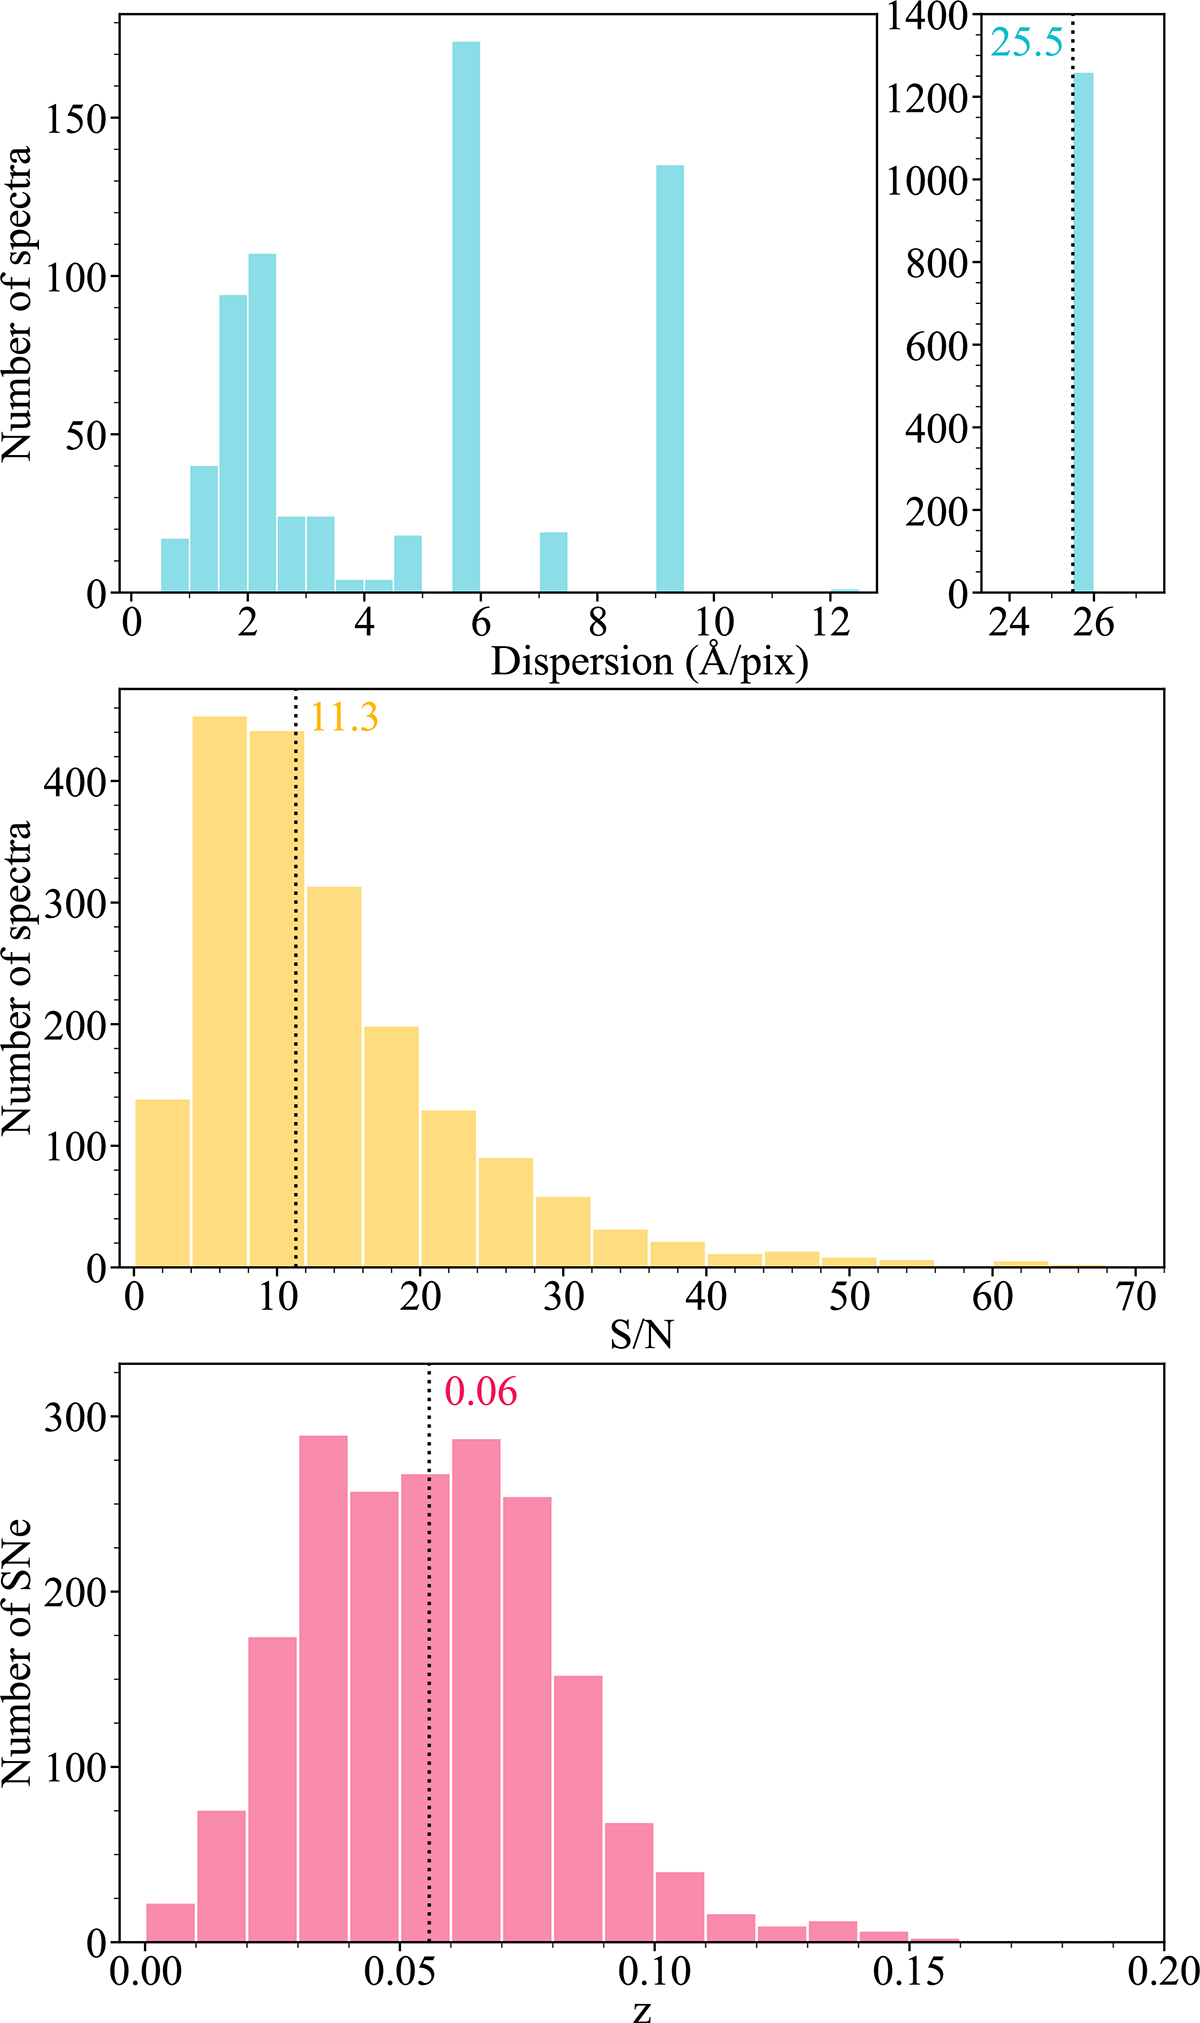
Fig. 1.
Download original image
Distributions of resolution and S/N in the 1930 spectra before the peak covering the relevant wavelength region with a clean enough signal for the S/N estimation. The bottom panel represents the redshift distribution of the 1557 objects sampled by these spectra. The dotted lines and accompanying values correspond to the medians of the three measurements. Final cuts upon S/N and resolution will be implemented based upon the results of the simulated fits.
Current usage metrics show cumulative count of Article Views (full-text article views including HTML views, PDF and ePub downloads, according to the available data) and Abstracts Views on Vision4Press platform.
Data correspond to usage on the plateform after 2015. The current usage metrics is available 48-96 hours after online publication and is updated daily on week days.
Initial download of the metrics may take a while.