Open Access
Fig. 4.
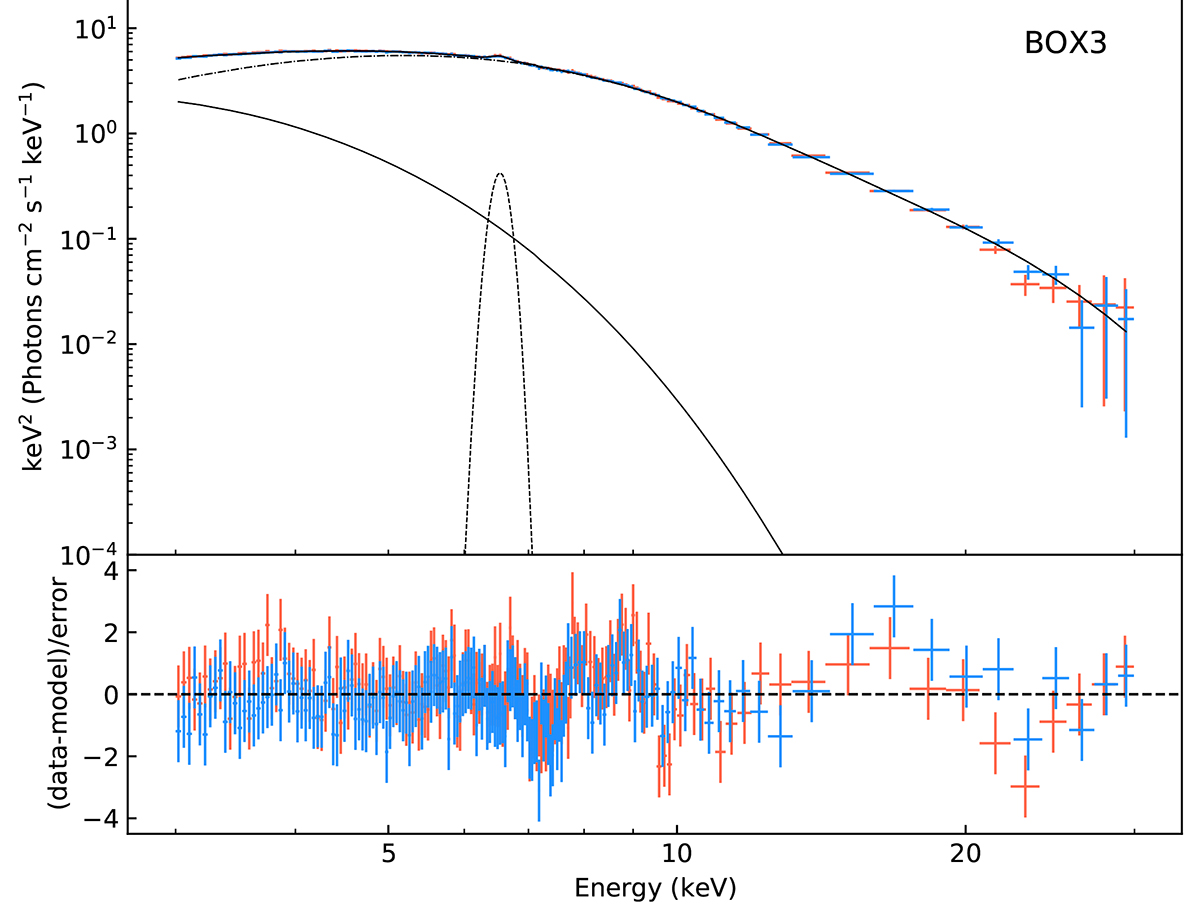
Download original image
NuSTAR spectrum fit with Model 1. The blue and orange points represent FPMA and FPMB, respectively. The full model is shown with a thick, solid line, the thermal emission diskbb with a dashed line, and the Comptonization component thcomp with a dash-dotted line.
Current usage metrics show cumulative count of Article Views (full-text article views including HTML views, PDF and ePub downloads, according to the available data) and Abstracts Views on Vision4Press platform.
Data correspond to usage on the plateform after 2015. The current usage metrics is available 48-96 hours after online publication and is updated daily on week days.
Initial download of the metrics may take a while.