Open Access
Fig. 1.
Download original image
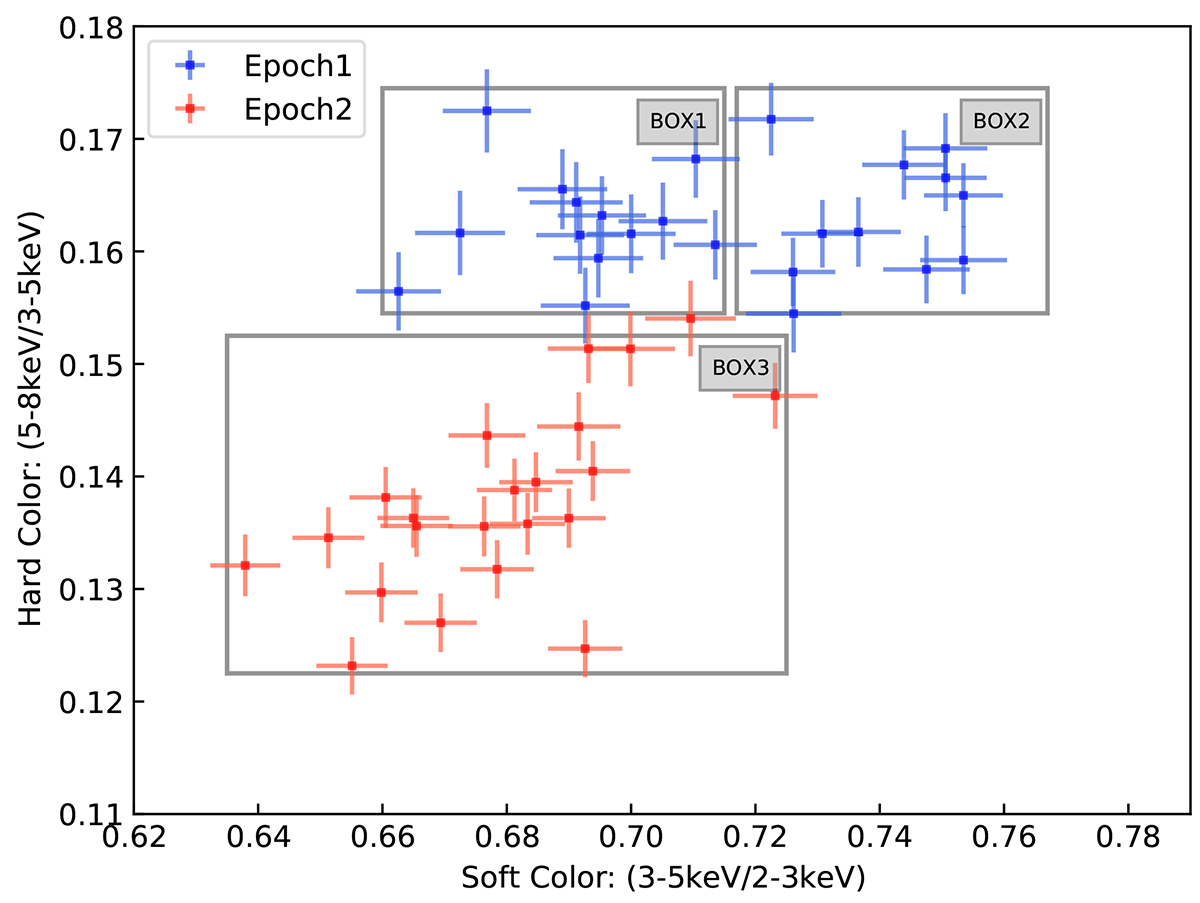
IXPE colour–colour diagram of XTE J1701–462. The hard and soft colours are defined as the count rate ratios 5–8 keV/3–5 keV and 3–5 keV/2–3 keV, respectively. The blue points correspond to Epoch1 in the HB, while the orange points correspond to Epoch2 in the NB.
Current usage metrics show cumulative count of Article Views (full-text article views including HTML views, PDF and ePub downloads, according to the available data) and Abstracts Views on Vision4Press platform.
Data correspond to usage on the plateform after 2015. The current usage metrics is available 48-96 hours after online publication and is updated daily on week days.
Initial download of the metrics may take a while.