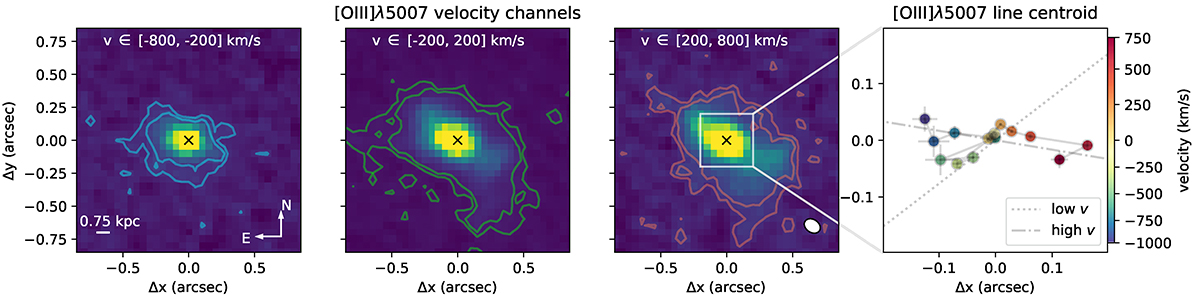
Fig. 6.
Download original image
[O III] velocity-channel maps (first-to-third panels) and spectroastrometry [O III] line positions (right panel). First to third panels: The velocity-channel maps were extracted from the ranges labelled in the individual panels. For each flux distribution, we report 3 and 5σ contour levels. The black cross identifies the GS133 nucleus, as inferred from spectroastrometry position of spectrally integrated [O III] profile (i.e. considering all velocity channels together); the white ellipse in the third panel represents the NIRSpec point spread function (PSF) at ∼2.2 μm (the [O III] observed wavelength) estimated by D’Eugenio et al. (2024); a scale bar and a compass are also reported in the first map. Right panel: Spectroastrometry of the [O III] emission, i.e. centroid positions of the line in the different velocity channels, covering a relatively small portion of the spatial extent shown in the velocity-channel maps (see white box in the third panel). The points are colour-coded by the channel velocity. The dot-dashed line roughly identifies the outflow axis, while the dotted line shows the tentative kinematic major axis of the GS133 rotating disc.
Current usage metrics show cumulative count of Article Views (full-text article views including HTML views, PDF and ePub downloads, according to the available data) and Abstracts Views on Vision4Press platform.
Data correspond to usage on the plateform after 2015. The current usage metrics is available 48-96 hours after online publication and is updated daily on week days.
Initial download of the metrics may take a while.