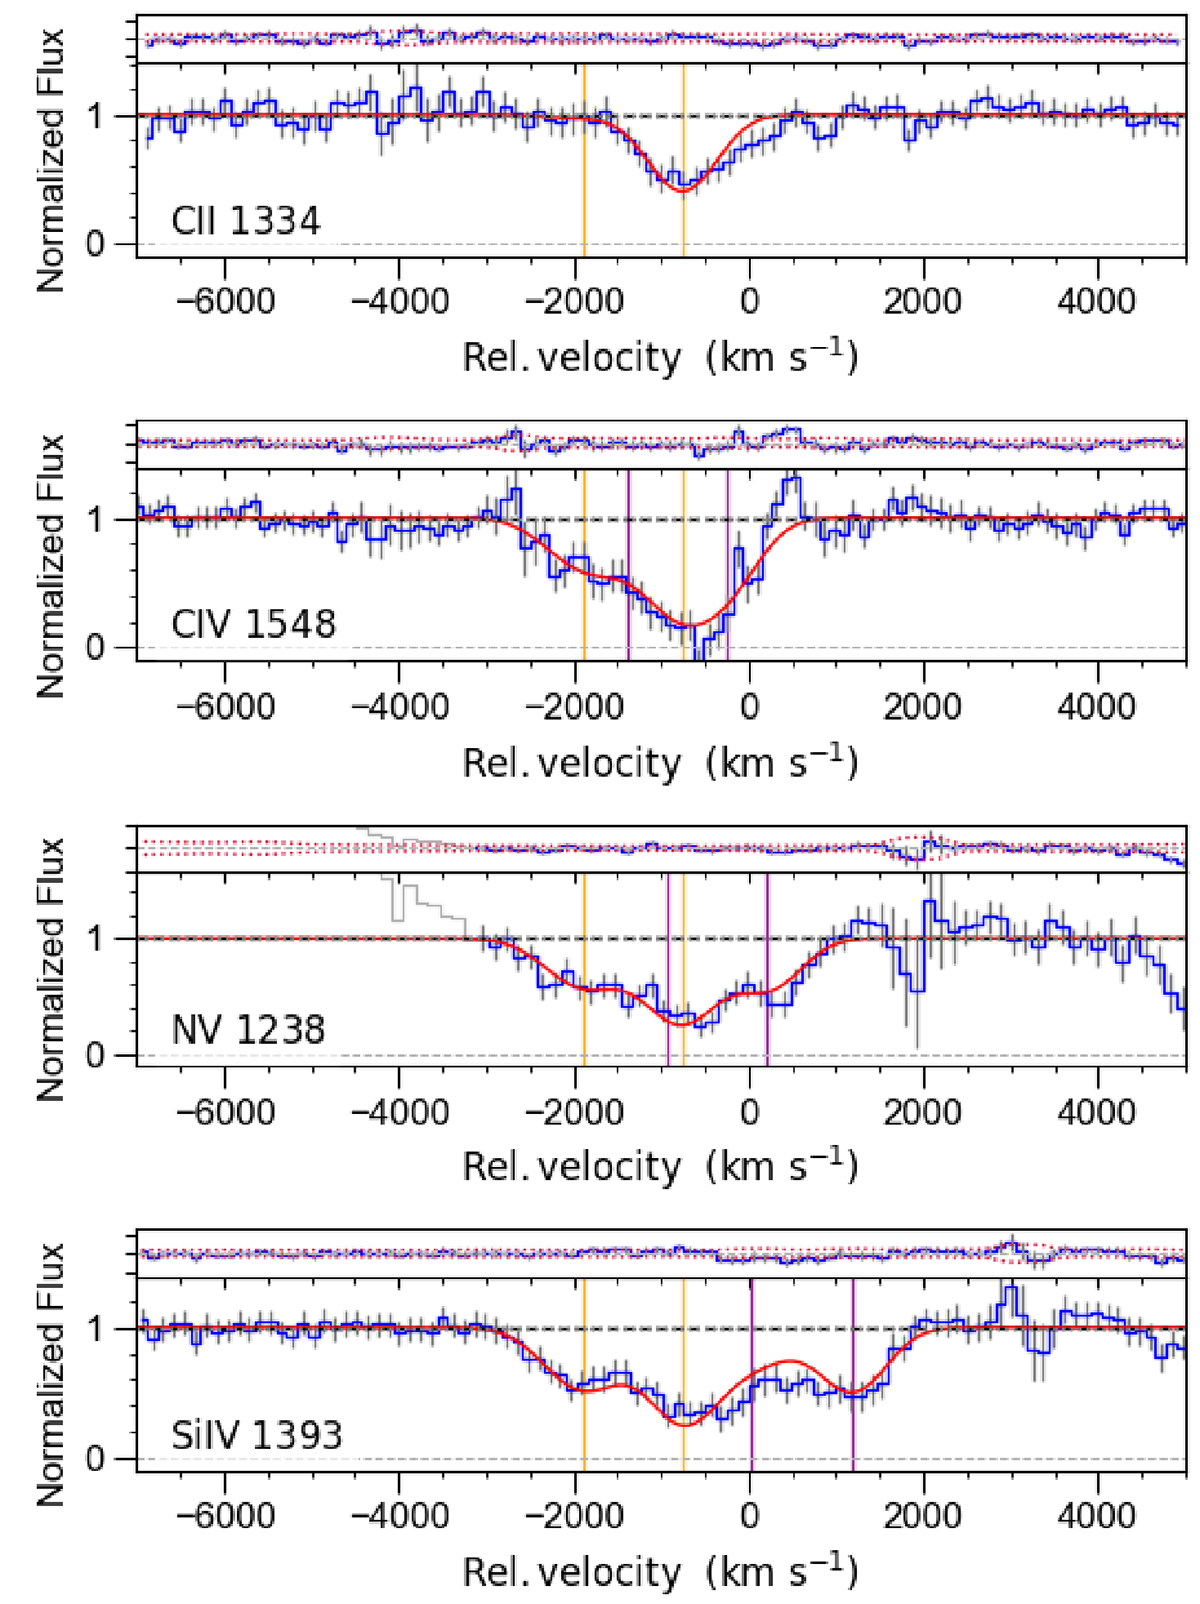
Fig. 4.
Download original image
VoigtFit models in velocity space. The normalised spectra, shown in blue with 3σ error bars, display the regions in the vicinity of the absorption lines; the best-fit models are overlaid in red. Carbon, nitrogen and silicon lines are fitted simultaneously, with two kinematic components; the vertical lines identify the velocity centroids for each kinematic component. For the doublets, the reported velocities are calculated with respect to the systemic of the blue line of the doublet; the kinematic components associated with the blue transitions are in orange, those of the red transitions are in purple. The narrow top panels show the best-fit residuals, with 3σ confidence intervals. Emission line contributions were removed prior to the VoigtFit modelling.
Current usage metrics show cumulative count of Article Views (full-text article views including HTML views, PDF and ePub downloads, according to the available data) and Abstracts Views on Vision4Press platform.
Data correspond to usage on the plateform after 2015. The current usage metrics is available 48-96 hours after online publication and is updated daily on week days.
Initial download of the metrics may take a while.