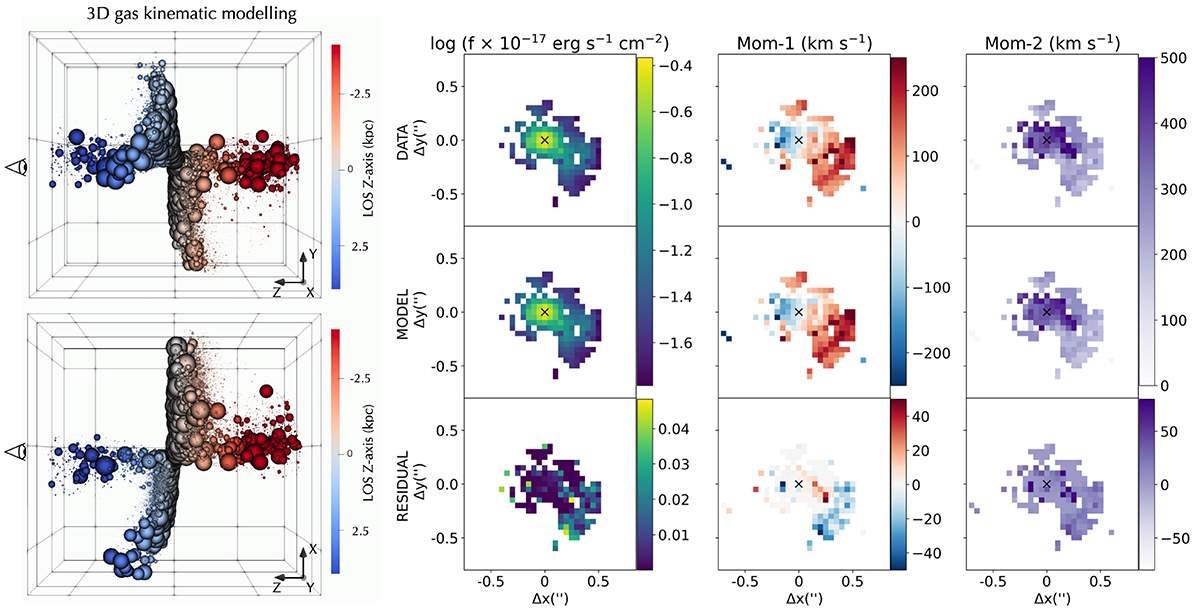
Fig. 12.
Download original image
MOKA3D model (left) and moment maps from NIRSpec data and MOKA3D model (right panels). In the 3D representations of the GS133 outflow structure, the XY represents the plane of the sky, while Z axis is the LOS. The observer is positioned on the left, and sees as blueshifted (redshifted) all the approaching (receding) gas, according to the colour bar; largest bubbles identify brightest clumps. The three-by-three panels show the comparison between the flux, Mom-1 and Mom-2 maps of [O III] (top panels) and MOKA3D model (middle panels) for the GS133 bi-conical outflow. The bottom panels present the residuals obtained subtracting the model from the data.
Current usage metrics show cumulative count of Article Views (full-text article views including HTML views, PDF and ePub downloads, according to the available data) and Abstracts Views on Vision4Press platform.
Data correspond to usage on the plateform after 2015. The current usage metrics is available 48-96 hours after online publication and is updated daily on week days.
Initial download of the metrics may take a while.