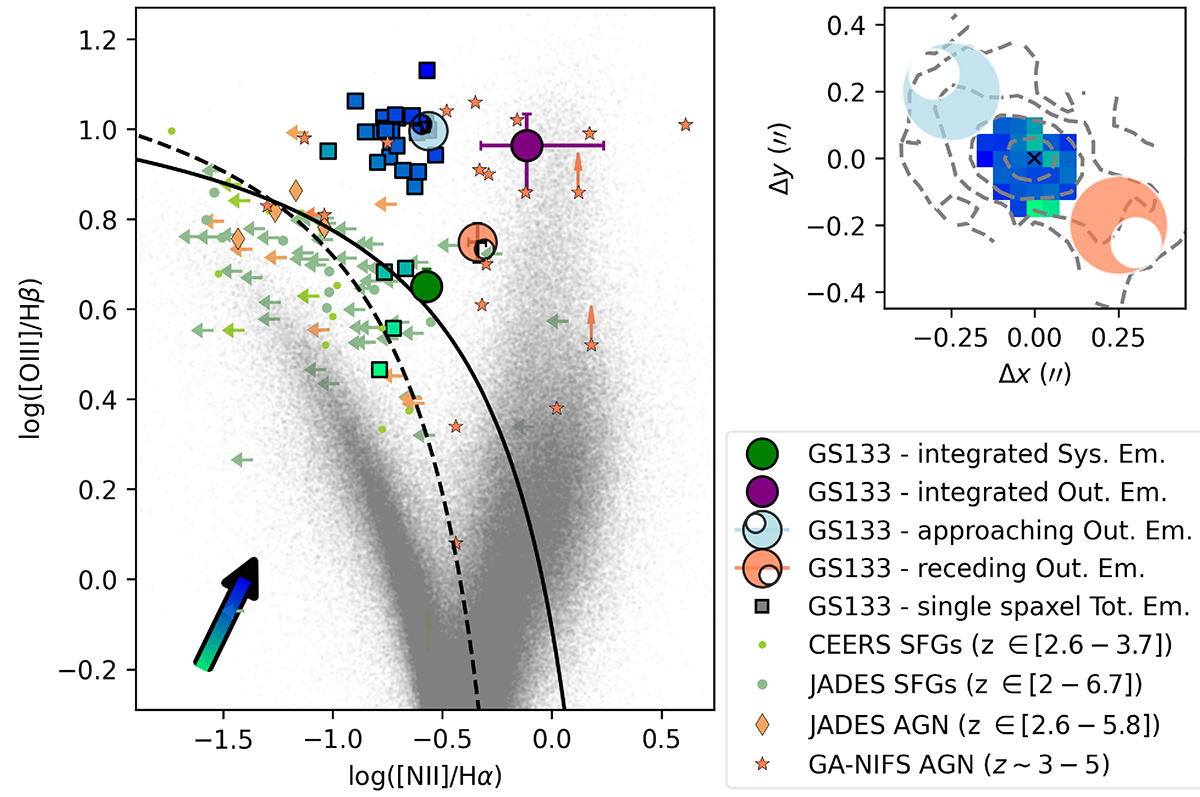
Fig. 10.
Download original image
Standard BPT diagnostic diagram. The colour-coded squares show GS133 single-spaxel measurements associated with the spatial regions shown in the top-right panel; green-to-blue colours mark increasing line ratios, as indicated with the arrow in the bottom-left part of the diagram; only spaxels with S/N > 3 in all lines are shown. The large green and purple circles display the line ratios measured from r = 0.5″ spatially integrated regions, for the systemic and outflow components, as labelled: the large crescent moon symbols refer to the outflow component line ratios measured in circular regions marked in the inset (with the same crescent moon symbols). The solid (Kewley et al. 2001) and dashed (Kauffmann et al. 2003) curves commonly used to separate purely star-forming galaxies (below the curves) from AGN (above the curves) are also reported. Finally, the BPT shows local galaxies from SDSS (Abazajian et al. 2009, indicated in grey), and additional measurements for z = 2.6 − 6.7 sources from the literature: star-forming galaxies are marked with small green symbols and refer to CEERS (Calabrò et al. 2023) and JADES (Scholtz et al. 2023) surveys, while AGN are marked with small orange symbols and refer to JADES (Scholtz et al. 2023) and GA-NIFS (Perna et al. 2023b) surveys.
Current usage metrics show cumulative count of Article Views (full-text article views including HTML views, PDF and ePub downloads, according to the available data) and Abstracts Views on Vision4Press platform.
Data correspond to usage on the plateform after 2015. The current usage metrics is available 48-96 hours after online publication and is updated daily on week days.
Initial download of the metrics may take a while.