Fig. 6.
Download original image
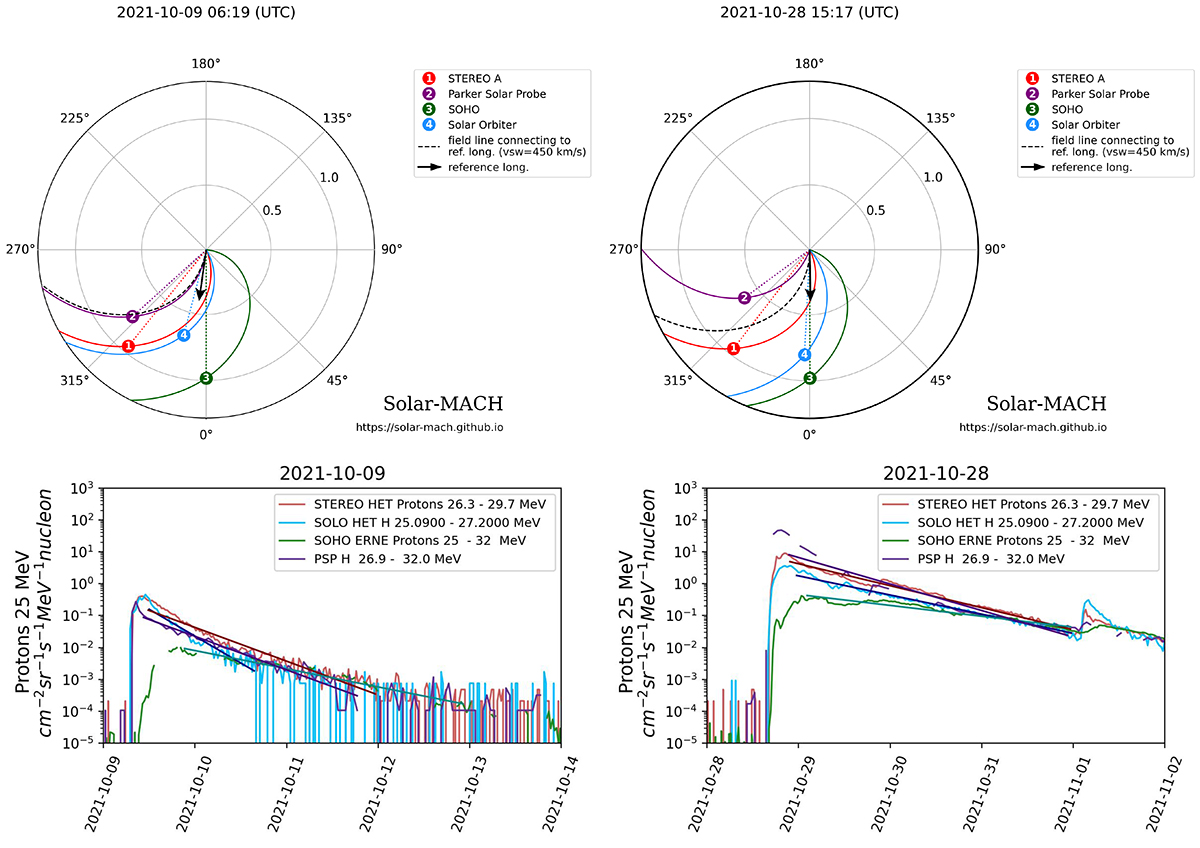
Spacecraft configurations (top panels) and SEP intensity profiles (bottom panels) for the two case study events 2021 October 9 (left) and 2021 October 28 (right). The spacecraft configurations are from Solar-MACH. The colour-coded circles indicate the spacecraft locations and nominal Parker spirals calculated from measured solar wind speed at the spacecraft. Multi-spacecraft SEP intensity profiles for the proton ∼ 25 MeV channel were made using SERPENTINE tools. The 2021 October 28 event decay is cut off by a second event that occurred on 2021 November 1.
Current usage metrics show cumulative count of Article Views (full-text article views including HTML views, PDF and ePub downloads, according to the available data) and Abstracts Views on Vision4Press platform.
Data correspond to usage on the plateform after 2015. The current usage metrics is available 48-96 hours after online publication and is updated daily on week days.
Initial download of the metrics may take a while.