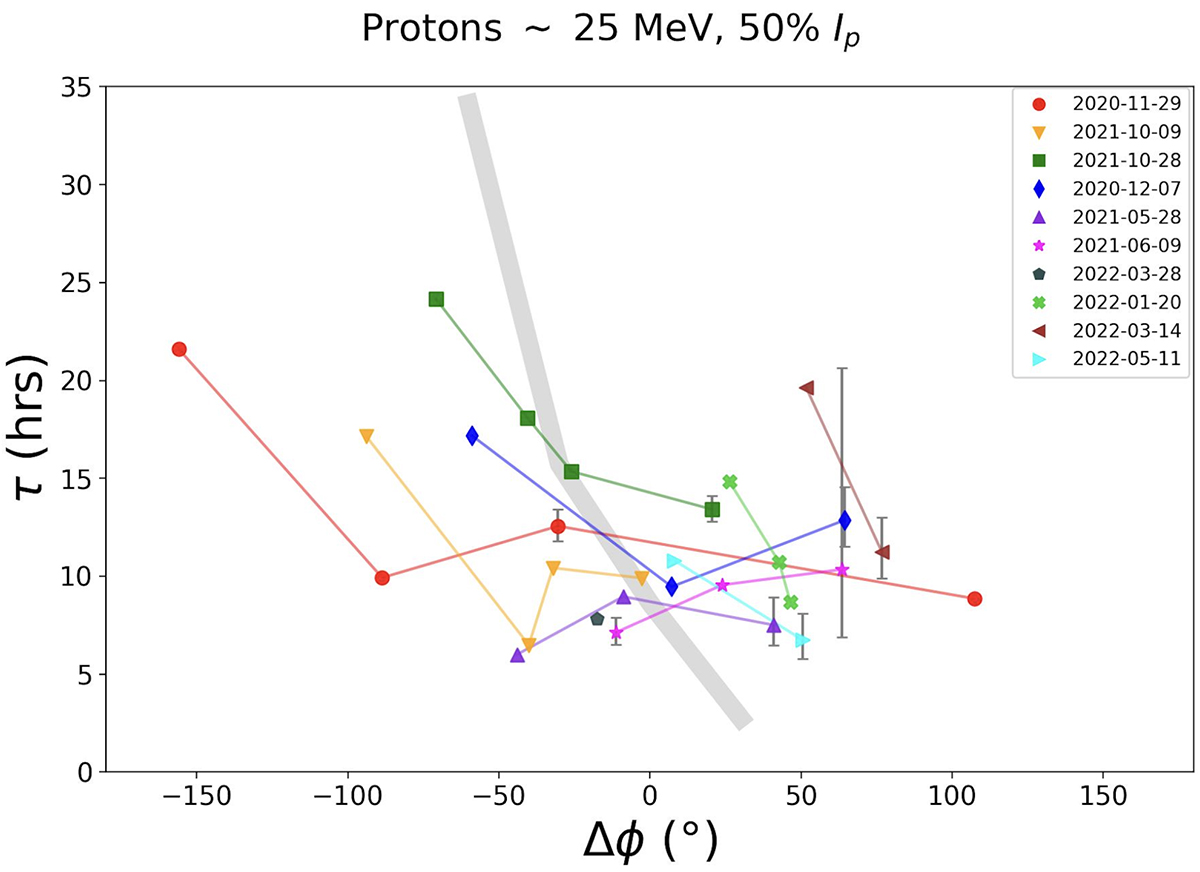
Fig. 12.
Download original image
Decay-time constant τ vs. longitudinal separation Δϕ (as given by Equation (2)) for ∼25 MeV protons. The start of the decay phase is defined as when intensities return to 50% of Ip. The coloured lines connect s/c data points for a single event. The grey shading shows results from a 25 MeV simulation run following the method of Hutchinson et al. (2023b). The error bars were omitted when they are smaller than the data points.
Current usage metrics show cumulative count of Article Views (full-text article views including HTML views, PDF and ePub downloads, according to the available data) and Abstracts Views on Vision4Press platform.
Data correspond to usage on the plateform after 2015. The current usage metrics is available 48-96 hours after online publication and is updated daily on week days.
Initial download of the metrics may take a while.