Open Access
Fig. 7.
Download original image
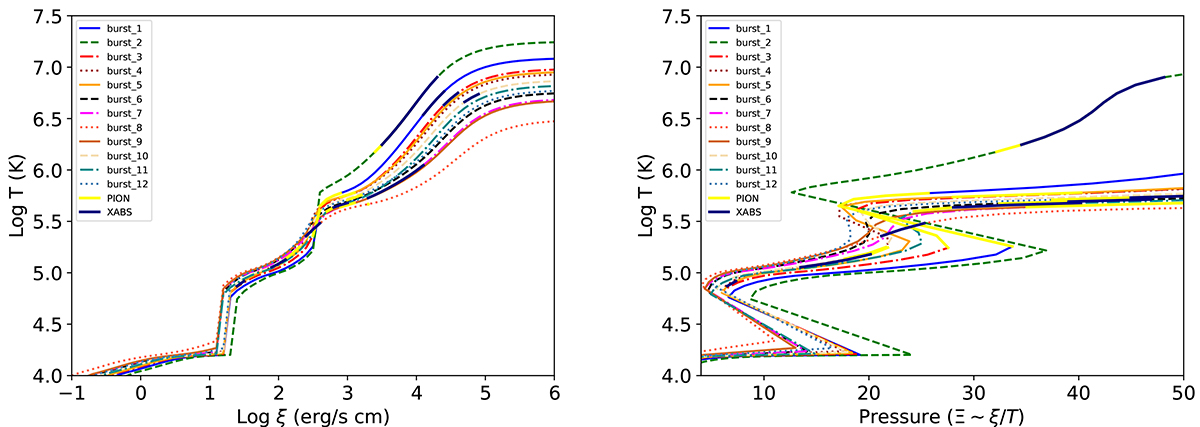
Ionisation balance (left) and thermal stability curves (right) computed for each burst. The regions with thermal instabilities are identified by the segments with negative slopes (right panel). The thicker segments show the ranges of the best-fitting solutions.
Current usage metrics show cumulative count of Article Views (full-text article views including HTML views, PDF and ePub downloads, according to the available data) and Abstracts Views on Vision4Press platform.
Data correspond to usage on the plateform after 2015. The current usage metrics is available 48-96 hours after online publication and is updated daily on week days.
Initial download of the metrics may take a while.