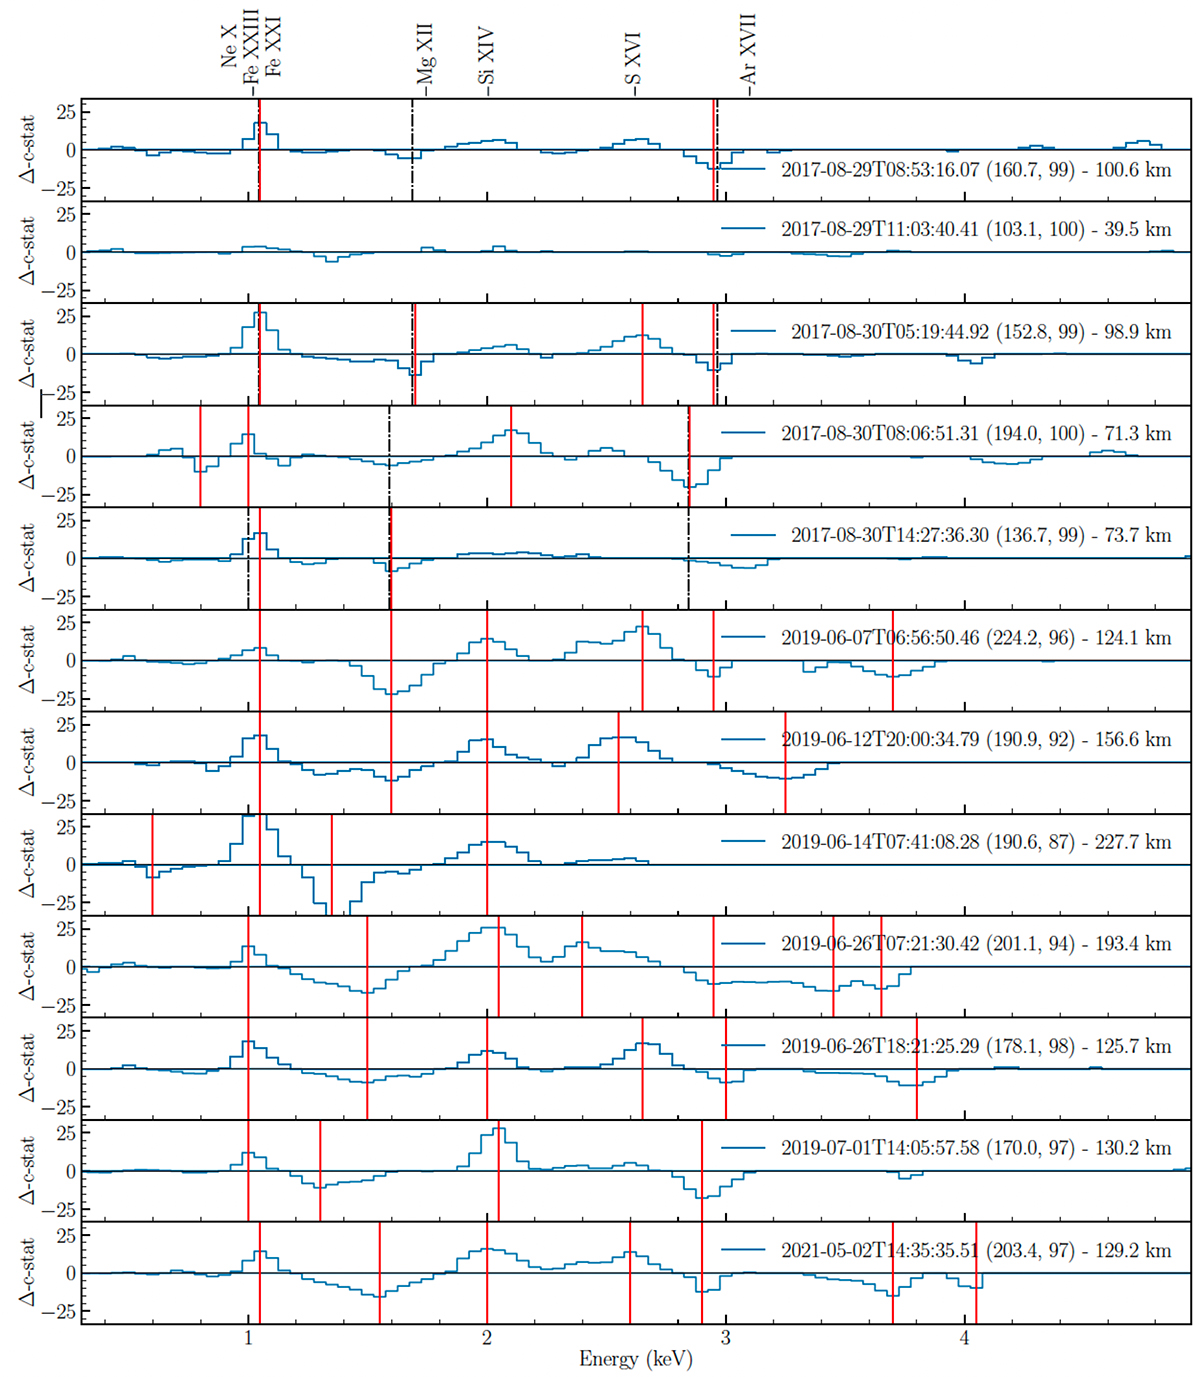
Fig. 3.
Download original image
Gaussian line scans for intervals of 0.7 second durations. The best-fit results for the radii expressed in km for a source distance of 8 kpc are obtained with the spectra optimally binned. The best-fit C-STAT and the number of degrees of freedom are given in parenthesis. The lines reported in Strohmayer et al. (2019) are shown as vertical black dash-dotted lines for four of the first five bursts. The position of the local extrema found in the scan are shown with the vertical red lines.
Current usage metrics show cumulative count of Article Views (full-text article views including HTML views, PDF and ePub downloads, according to the available data) and Abstracts Views on Vision4Press platform.
Data correspond to usage on the plateform after 2015. The current usage metrics is available 48-96 hours after online publication and is updated daily on week days.
Initial download of the metrics may take a while.