Fig. 9
Download original image
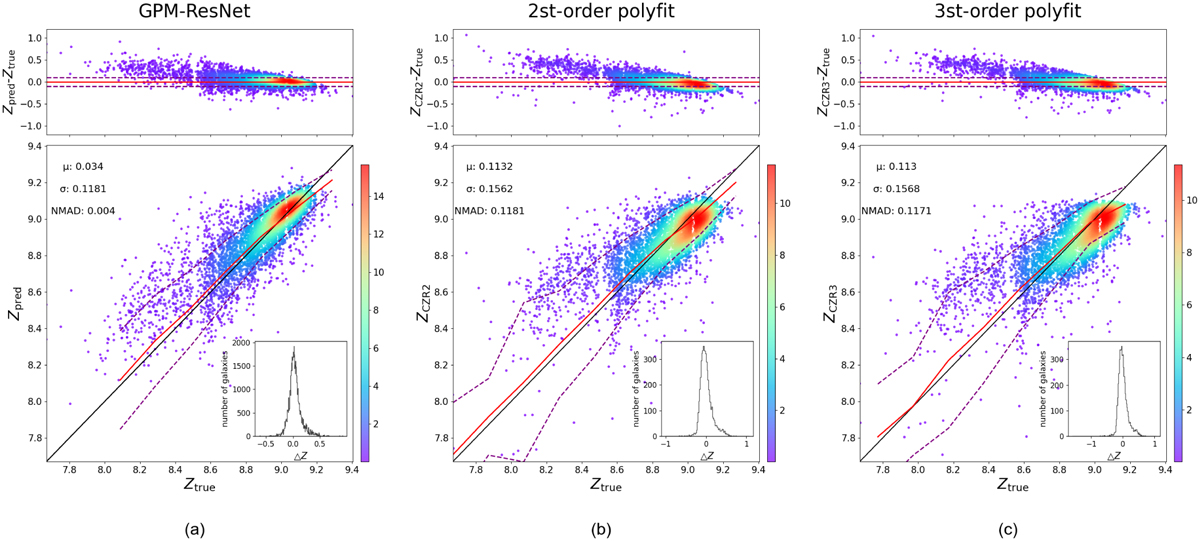
(a) The Zpred obtained using GPM-ResNet. (b and c) The predicted results obtained from second-order and third-order polynomials fit based on the color-metallicity relation, respectively. In all three subplots, the top panel represents the residual density plot, where the solid red line represents y = 0 and the dashed purple line represents y = ±0.1dex. The bottom panel illustrates the density distribution: the solid black line indicates the 1:1 relationship; the solid red line represents the median line of Zpred, which varies with Ztrue; and the dashed purple line denotes the 1 σ scatter around the median. Each point represents a galaxy sample, and color coding highlights the kernel density estimation of galaxy density.
Current usage metrics show cumulative count of Article Views (full-text article views including HTML views, PDF and ePub downloads, according to the available data) and Abstracts Views on Vision4Press platform.
Data correspond to usage on the plateform after 2015. The current usage metrics is available 48-96 hours after online publication and is updated daily on week days.
Initial download of the metrics may take a while.