Open Access
Fig. 8
Download original image
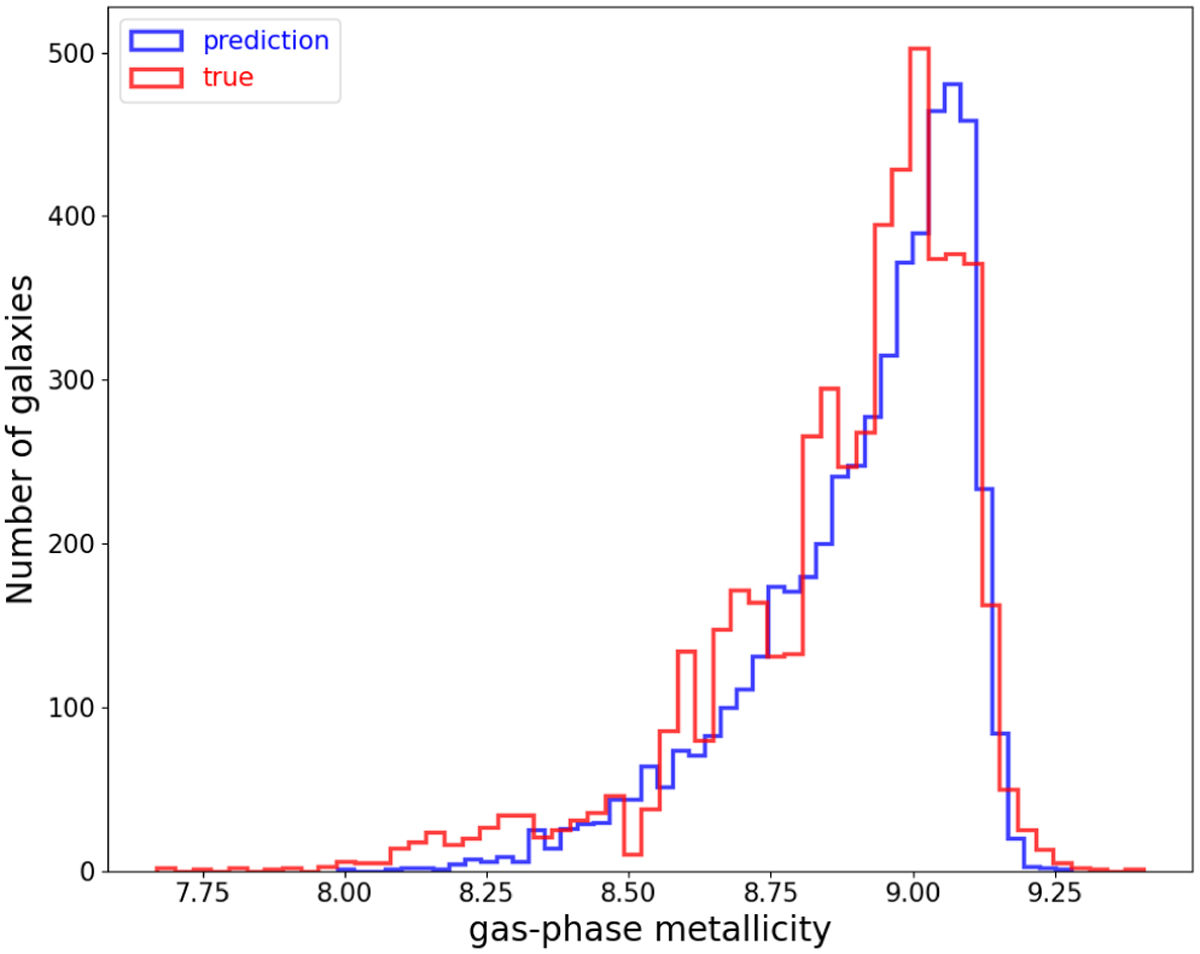
Histogram illustrating the distribution of the gas-phase metal- licity in galaxies, with the blue line representing Zpred and the red line representing Ztrue. The bin widths for these two distributions are different.
Current usage metrics show cumulative count of Article Views (full-text article views including HTML views, PDF and ePub downloads, according to the available data) and Abstracts Views on Vision4Press platform.
Data correspond to usage on the plateform after 2015. The current usage metrics is available 48-96 hours after online publication and is updated daily on week days.
Initial download of the metrics may take a while.