Fig. 16
Download original image
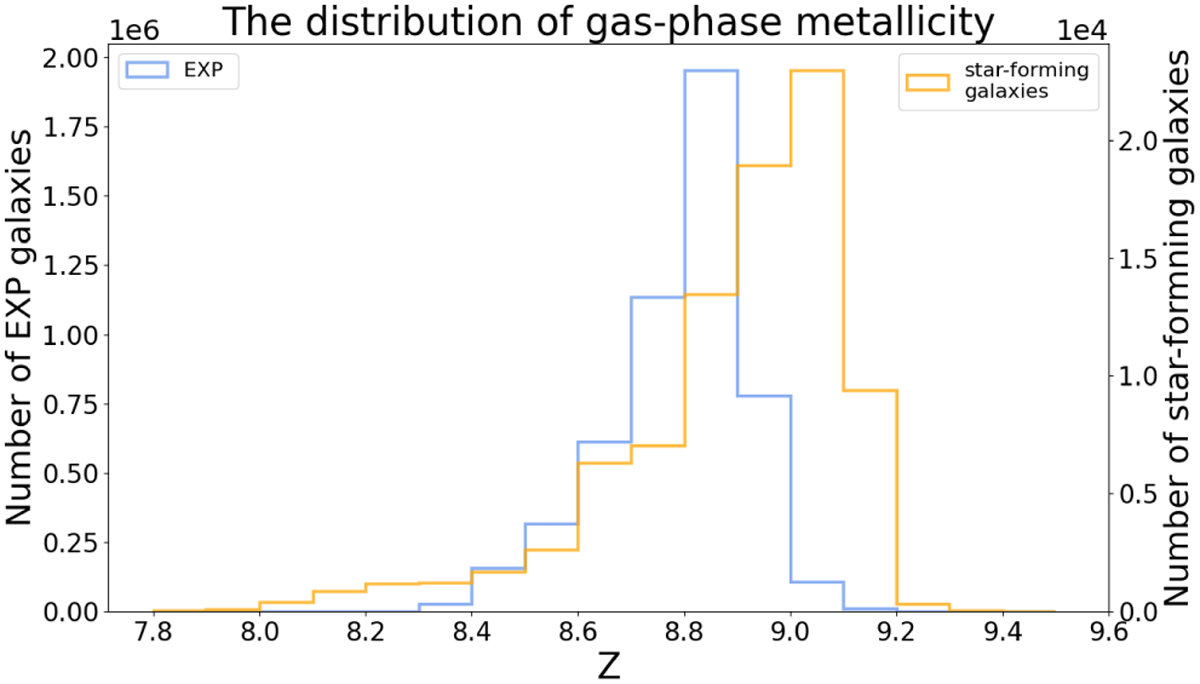
Comparison of the gas-phase metallicity distribution between EXP galaxies and star-forming galaxies in the DESI DR9 dataset. The blue curve represents the distribution of EXP galaxies, with the gasphase metallicity values (Z_pred) predicted using the GPM-ResNet model; while the yellow curve shows the distribution of star-forming galaxies, with their gas-phase metallicity values (oh_p50) obtained from the SDSS MPA-JHU DR8 catalog. The left y-axis displays the number of EXP galaxies, while the right y-axis shows the number of starforming galaxies. Both y axes are presented in scientific notation.
Current usage metrics show cumulative count of Article Views (full-text article views including HTML views, PDF and ePub downloads, according to the available data) and Abstracts Views on Vision4Press platform.
Data correspond to usage on the plateform after 2015. The current usage metrics is available 48-96 hours after online publication and is updated daily on week days.
Initial download of the metrics may take a while.