Fig. 13
Download original image
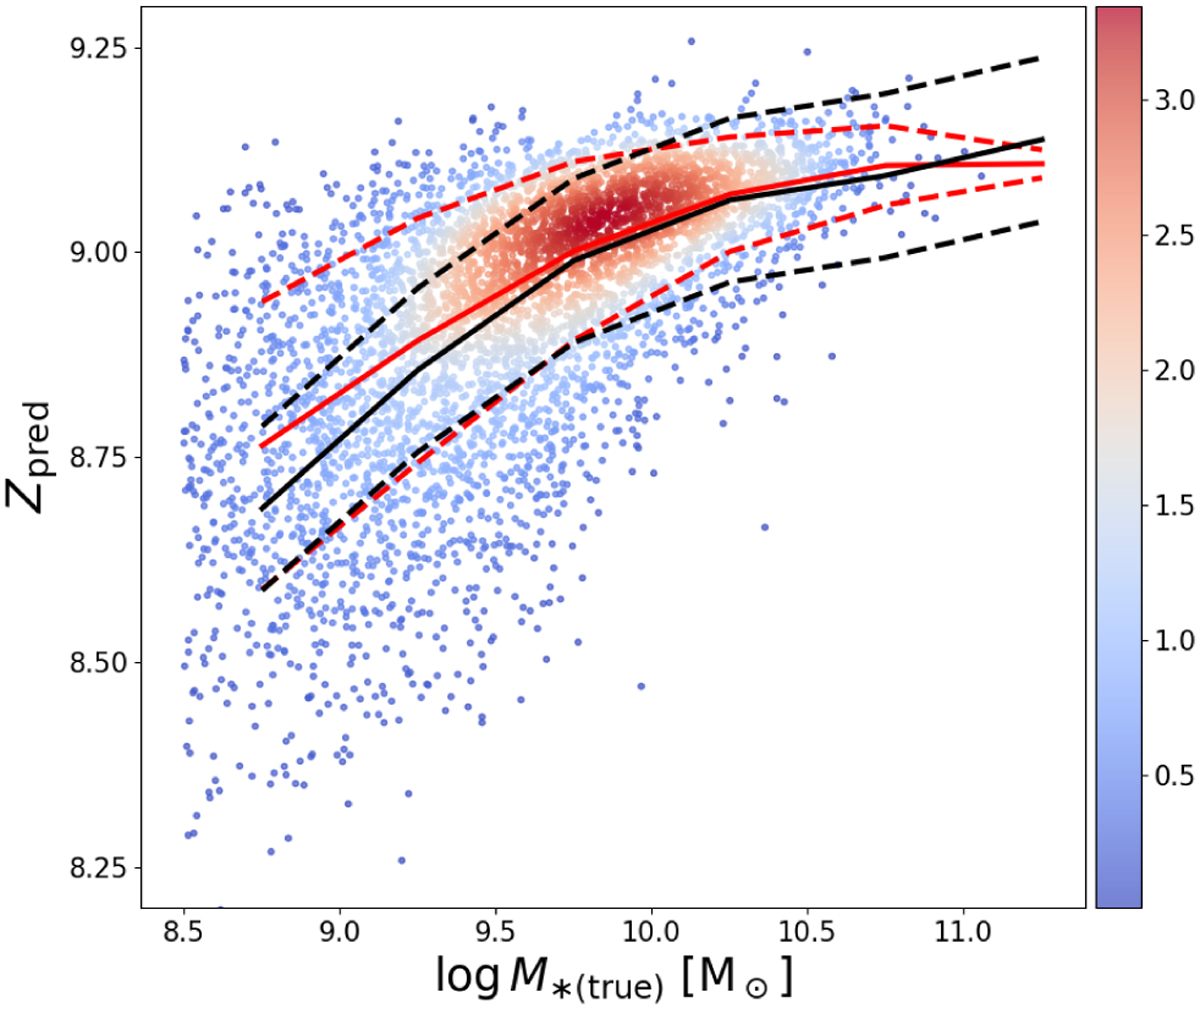
MZR recovered through Zpred. The solid red line represents the median of Zpred, while the dashed red line indicates the ±1σ range relative to the median line. The solid black line shows the median relation of the MZR proposed by Tremonti et al. (2004), and the dashed black line represents the ±1σ range, which is 0.1 dex from this median line. These lines clearly illustrate the relationship between the MZR recovered from Zpred and the empirical MZR.
Current usage metrics show cumulative count of Article Views (full-text article views including HTML views, PDF and ePub downloads, according to the available data) and Abstracts Views on Vision4Press platform.
Data correspond to usage on the plateform after 2015. The current usage metrics is available 48-96 hours after online publication and is updated daily on week days.
Initial download of the metrics may take a while.