Fig. 12
Download original image
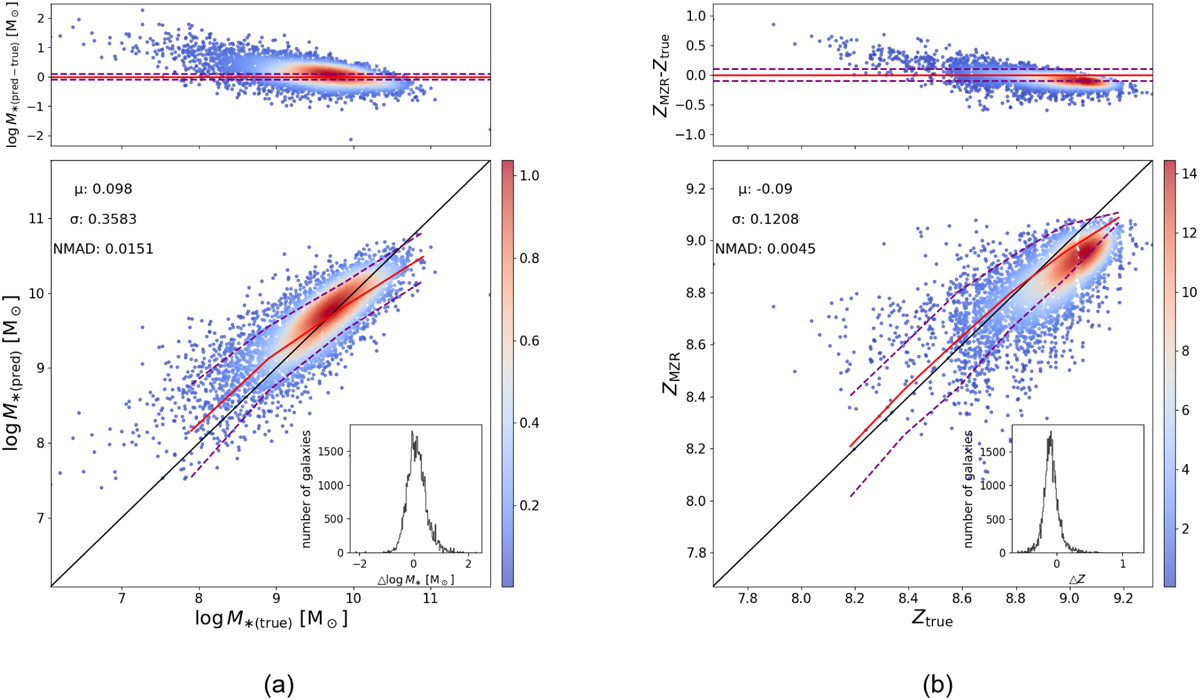
(a) The results of estimating stellar mass using the GPM-ResNet method. (b) The derived gas-phase metallicity values based on the MZR. The top panel of both subplots displays the residual density plot, where the solid red line represents y = 0 and the dashed purple line represents y = ±0.1dex. The bottom panel is a density plot, with solid black lines indicating a 1:1 relationship; the solid red line represents the median line of the predicted values, and the dashed purple line represents 1 σ scatter around the median. The meanings of these lines are consistent with the corresponding lines in Figure 9. The color coding in the figures emphasizes the core density estimation of the galaxies.
Current usage metrics show cumulative count of Article Views (full-text article views including HTML views, PDF and ePub downloads, according to the available data) and Abstracts Views on Vision4Press platform.
Data correspond to usage on the plateform after 2015. The current usage metrics is available 48-96 hours after online publication and is updated daily on week days.
Initial download of the metrics may take a while.