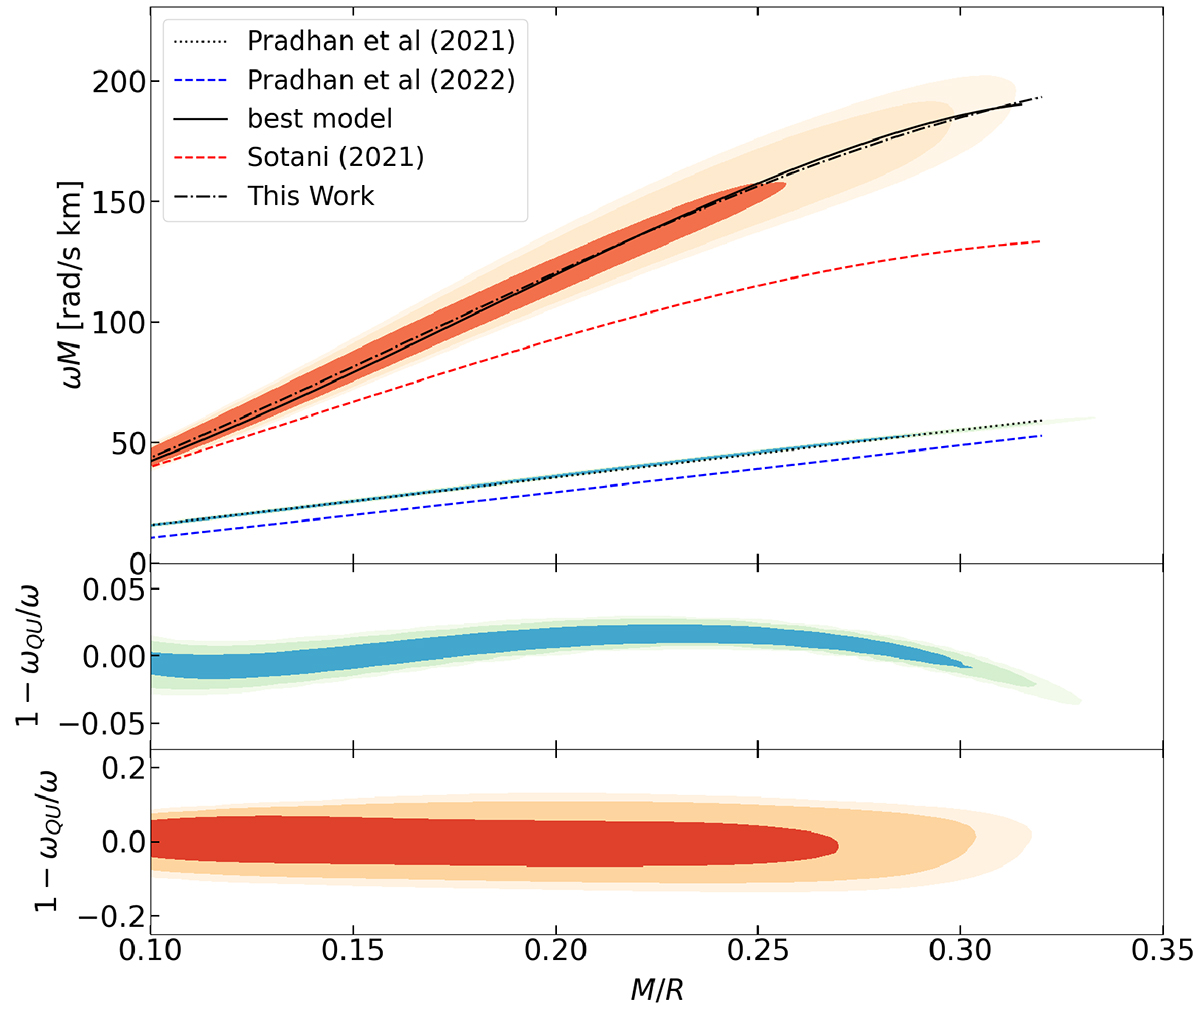
Fig. 4.
Download original image
Relationship between rescaled pulsations ωM and compactness M/R for the frozen f modes (blue-green) and frozen p1 modes (orange-yellow). The dashed lines correspond to the fits presented in Table 1, while the solid black line represents the model ℳ(X) with the highest likelihood ℒ(X). The fit lines overlapping with the distributions are based on the Cowling approximation, whereas the others, obtained in full GR, are shown for comparison. The differences between the rescaled pulsations ωM calculated in the Cowling approximation and the corresponding QU fits are illustrated in the two lower panels. Each panel also includes three shaded regions representing the 68%, 95%, and 99% quantiles of the distribution.
Current usage metrics show cumulative count of Article Views (full-text article views including HTML views, PDF and ePub downloads, according to the available data) and Abstracts Views on Vision4Press platform.
Data correspond to usage on the plateform after 2015. The current usage metrics is available 48-96 hours after online publication and is updated daily on week days.
Initial download of the metrics may take a while.