| Issue |
A&A
Volume 635, March 2020
|
|
|---|---|---|
| Article Number | A84 | |
| Number of page(s) | 8 | |
| Section | Stellar structure and evolution | |
| DOI | https://doi.org/10.1051/0004-6361/201937236 | |
| Published online | 11 March 2020 | |
Crystallization of the inner crust of a neutron star and the influence of shell effects
1
LPC (CNRS/ENSICAEN/Université de Caen Normandie), UMR6534, 14050 Caen Cédex, France
e-mail: carreau@lpccaen.in2p3.fr
2
Institut d’Astronomie et d’Astrophysique, CP-226, Université Libre de Bruxelles, 1050 Brussels, Belgium
3
Grand Accélérateur National d’Ions Lourds (GANIL), CEA/DRF – CNRS/IN2P3, Boulevard Henri Becquerel, 14076 Caen, France
4
Dépt. de Physique, Université de Montréal, Montréal, Québec H3C 3J7, Canada
Received:
3
December
2019
Accepted:
17
January
2020
Context. In the cooling process of a non-accreting neutron star, the composition and properties of the crust are thought to be fixed at the finite temperature where nuclear reactions fall out of equilibrium. A lower estimate for this temperature is given by the crystallization temperature, which can be as high as ≈7 × 10⁹ K in the inner crust, potentially leading to sizeable differences with respect to the simplifying cold-catalyzed matter hypothesis.
Aims. We extend a recent work on the outer crust to the study of the crystallization of the inner crust and the associated composition in the one-component plasma approximation.
Methods. The finite temperature variational equations for non-uniform matter in both the liquid and the solid phases are solved using a compressible liquid-drop approach with parameters optimized on four different microscopic models that cover current uncertainties in nuclear modeling.
Results. We consider the effect of the different nuclear ingredients with their associated uncertainties separately: the nuclear equation of state, the surface properties in the presence of a uniform gas of dripped neutrons, and the proton shell effects arising from the ion single-particle structure. Our results suggest that the highest source of model dependence comes from the smooth part of the nuclear functional.
Conclusions. We show that shell effects play an important role at the lowest densities close to the outer crust, but the most important physical ingredient to be settled for a quantitative prediction of the inner crust properties is the surface tension at extreme isospin values.
Key words: stars: neutron / dense matter / plasmas
© T. Carreau et al. 2020
 Open Access article, published by EDP Sciences, under the terms of the Creative Commons Attribution License (http://creativecommons.org/licenses/by/4.0), which permits unrestricted use, distribution, and reproduction in any medium, provided the original work is properly cited.
1. Introduction
The essential input determining the composition of the outer crust of a cold non-accreting neutron star (NS) under the cold-catalyzed matter hypothesis is given by the masses of the atomic nuclei, which are confined to the crystalline ion sites. These masses are experimentally measured to a high level of accuracy, meaning that the properties of the outermost layers of the crust are precisely known (Blaschke & Chamel 2018). However, for the regions deeper inside the star, matter becomes so neutron rich that experimental data are not available, and model dependence arises. The uncertainty due to modeling becomes a critical aspect in the inner crust, which extends from ≈300 m below the surface to about 1 km in depth; in this region, neutrons drip off nuclei, forming a gas. This situation cannot be reproduced in the laboratory.
In the inner crust regime, the properties of matter depend on the energetics of both neutron matter and extremely exotic neutron-rich nuclei, which can only be accessed by nuclear modeling. In turn, the masses of dripline nuclei as calculated by nuclear models depend on the bulk properties of asymmetric nuclear matter1 as expressed by the so-called nuclear equation of state (EoS), but also on the details of nuclear structure. These include surface properties arising from the finite size of the nucleus, as well as shell corrections arising from the underlying single-particle structure of the nuclei.
In recent years, huge progress has been made in constraining the properties of the nuclear EoS from astrophysical observations, ab initio calculations, and nuclear experiments, see Burgio & Fantina (2018) for a recent review. It is therefore interesting to study how much these constraints affect the uncertainties in predicting the composition of the inner crust.
An additional complication arises from the fact that the crust of a NS is unlikely to be in full thermodynamic equilibrium at zero temperature. In reality, NSs are born hot, and if their core cools down sufficiently rapidly, the composition might be frozen at a finite temperature, see for instance Goriely et al. (2011). Deviations from the ground-state composition in the cooled crust around the neutron-drip density have previously been considered in Bisnovatyi-Kogan & Chechetkin (1979), but simple extrapolations of semi-empirical mass formulas were used at that time. The value of the freeze-out temperature is difficult to evaluate, but a lower limit is given by the crystallization temperature because we can expect that nuclear reactions are fully inhibited in a Coulomb crystal.
Fantina et al. (2020) recently studied the crystallization of the outer crust of a non-accreting unmagnetized NS in the one-component plasma (OCP) approximation using the microscopic HFB-24 nuclear mass model based on deformed Hartree–Fock–Bogoliubov calculations (Goriely et al. 2013). The underlying functional BSk24 has also recently been used to determine the ground-state composition and the EoS in all regions of a non-accreting NS by Pearson et al. (2018). We here extend the work of Pearson et al. (2018) and Fantina et al. (2020) by calculating the crystallization temperature and the associated composition in the inner crust in the OCP approximation. To this end, we solve the variational equations for non-uniform matter within the compressible liquid-drop (CLD) approach presented in Carreau et al. (2019). This formalism is presented in Sect. 2. The use of the CLD approach additionally allows us to address the question of the model dependence of the results. In this semi-classical approach, shell effects are added to the smooth EoS functional using the Strutinsky integral method, as explained in Sect. 3. This allows an independent variation of the bulk parameters, the surface parameters, and the shell effects, and a comparison of the relative importance of the three different microscopic ingredients. This is discussed in Sect. 4 by considering four different realistic microscopic functionals providing comparably good reproduction of various experimental and theoretical nuclear data, taken from Goriely et al. (2013) and Pearson et al. (2018). In particular, we show that the uncertainties associated with the nuclear model lead to an uncertainty in the crystallization temperature that can exceed 40% in the innermost layers of the crust. This variation in the crystallization temperature might have important implications not only for the static properties of the crust, such as its composition, but also for the cooling timescale of young NSs, as discussed by Gnedin et al. (2001; see their Figs. 6 and 7). Finally, we present our conclusions in Sect. 5.
The freezing of the crust composition at a finite temperature also implies that an important contribution of impurities is expected at each depth, which is important for transport properties (see e.g. Schmitt & Shternin 1961 and Gourgouliatos & Esposito 2013 for recent reviews). Indeed, we have observed that the energy difference between local minima is typically much lower than the thermal energy at the crystallization point. Our formalism can be extended to account for this distribution of nuclei, following an approach similar to that of Fantina et al. (2020) for the outer crust. This extension allows a microscopic evaluation of the nuclear distribution and the associated impurity factor. It will be presented in a forthcoming paper.
2. Model of the inner crust
In the homogeneous matter limit, an EoS model corresponds to a given free energy functional for bulk nuclear matter at proton (neutron) density np(nn) and temperature T, fb(nB, δ, T), with nB = np + nn, δ = (nn − np)/nB and fb the free energy per baryon. We used the four different functionals of the BSk family taken from Goriely et al. (2013): BSk22, BSk24, BSk25, and BSk26. These models were chosen because they all provide excellent fits to the 2016 Atomic Mass Evaluation (AME; Wang et al. 2017), are compatible both with ab initio and NS mass constraints, and explore a relatively large domain in the symmetry energy parameters (consistent with existing experimental constraints), which constitute the most important part of the EoS uncertainty (Pearson et al. 2014, 2018). Moreover, full mass tables obtained by deformed Hartree–Fock–Bogoliubov (HFB) calculations have been published for these models2.
After we defined the EoS model, we obtained the equilibrium configuration of inhomogeneous dense matter in the inner crust in full thermodynamic equilibrium at temperature T and baryon density nB following Lattimer & Swesty (1991) and Gulminelli & Raduta (2015), who extended the variational formalism of Baym et al. (1971a) and Douchin & Haensel (2001) to finite temperature.
We used the Lagrange multipliers technique to minimize the free-energy density in a Wigner–Seitz cell of volume V with the constraint of a given baryon density nB. The auxiliary function to be minimized reads
where ℱg = ngfb(ng, 1, T)+ngmnc2 (ℱe) is the free energy density3 of a pure uniform neutron (electron) gas at density ng (ne), and the bulk interaction between the nucleus and the neutron gas is treated in the excluded volume approximation. As discussed by Pearson et al. (2012), minimizing F at fixed baryon density is practically equivalent to minimizing the Gibbs free energy G at fixed pressure. The term Fi corresponds to the free energy of a fully ionized atom of mass number A, atomic number Z, and density n0, including the Coulomb (nuclear) interaction with the electron (neutron) gas, and is given by (see Chap. 2 in Haensel et al. 2007)

where mn(p) is the neutron (proton) mass, c is the speed of light, Fnuc is the free energy associated with the nuclear and electrostatic interactions among nucleons,  is the non-interacting (“ideal”) contribution to the ion free energy, and
  accounts for Coulomb electron–ion and electron–electron interactions.
Depending on the phase, either solid or liquid, different expressions enter the ideal  and non-ideal
  free energy terms in addition to the finite-size contribution, which is common to both phases. The full expressions for the different terms can be found in Fantina et al. (2020). The most important term determining the transition from the liquid to the solid phase is
  , specifically, the zero-point quantum-vibration term in the solid phase, and the translational term in the liquid phase. Exchange and polarization corrections are found to have no effect in the density and temperature regime we studied here and are therefore neglected. We also ignore the possible presence of free protons, which are expected to be negligible in the low temperatures and proton fractions that characterize the inner crust around the crystallization point.
The nuclear free energy Fnuc is the same in the liquid and solid phases, and it is calculated in the CLD approximation,

where the bulk neutron–proton asymmetry is given by I = 1−2Z/A.
Assuming spherical geometry, we write the Coulomb energy as
with r0 = (4πn0/3)−1/3, n0 the (average) baryon density inside the ion, e the elementary charge, and the surface and curvature free energies as in Newton et al. (2013),
with α = 5.5. The expression for the surface tension σs is given in Lattimer & Swesty (1991) and is suggested from Thomas–Fermi calculations in the Wigner–Seitz cell in the free neutron regime,
In Eqs. (5) and (6), the surface and curvature parameters σ0, bs, σ0, c, and β govern the surface properties of nuclei at moderate asymmetries below the onset of neutron drip. Following the same strategy as in Carreau et al. (2019), they can be fixed by fitting the T = 0 limit of Eq. (3) to a given mass table. For this study, we have built full fourth-order extended Thomas–Fermi (ETF) mass tables for each of the functionals BSk22, BSk24, BSk25, or BSk26, and fit the parameters of Eq. (6) to the ETF results4. The function h effectively accounts for the excitation of surface modes at finite temperature, h(T > Tc) = 0 and  , see Eq. (2.31) of Lattimer & Swesty (1991). Because the critical temperature Tc is of the order of Tc ≈ 1.75 × 10¹¹ K and the crystallization temperature is lower than 1010 K in the inner crust, h ≈ 1 and the excitation of surface modes can thus be neglected.
Finally, the p parameter determines the behavior of the surface tension at high isospin above the neutron-drip transition and effectively accounts for the nuclear interaction between the nucleus and the surrounding neutron gas, which can be modeled as a surface effect. We fixed it to reproduce the crust–core transition density for the four BSk functionals considered. The same value p = 3.0 is seen to provide a good reproduction of the transition points of the different functionals. These latter were obtained by Pearson et al. (2019) using the same method as in Ducoin et al. (2007), with the transition taking place when homogeneous NS matter becomes unstable against finite-size fluctuations. The corresponding optimized surface and curvature parameters are displayed in Table 1 (see also Table 14 of Pearson et al. 2018).
Surface and curvature parameters optimized to reproduce the crust–core transition properties of functionals BSk22, BSk24, BSk25, and BSk26.
The quality and flexibility of the parameterization Eq. (6) was in particular verified by Newton et al. (2013), showing that the seminal crust composition of Baym et al. (1971b) can be indeed reproduced with it.
Within the CLD approximation, at a given baryon density and temperature, the nuclear free energy Fnuc solely depends on the three parameters (A, I, n0), while the global free energy density additionally depends on the electron and free neutron densities, ne = np and ng. The equilibrium configuration is thus obtained by independent variations of the auxiliary function Eq. (1) with respect to the five variables A, I, n0, np, and ng using the baryon density constraint,
This leads to the following system of coupled differential equations:

where  is the electron chemical potential including the rest mass (see, e.g., Sect. 2.3.1 in Haensel et al. 2007), Δmn, p is the neutron–proton mass difference, the gas pressure is given by Pg = ngμ − ℱg, and the baryon chemical potential
  results
In our parameterization, the in-medium modification of the surface energy arising from the external gas is governed by a single parameter p that does not depend on the external neutron density, but only on the global asymmetry. Then ∂Fi/∂ng = 0 and the baryon chemical potential can be identified with the chemical potential of the gas μg ≡ dℱg/dng.
At each value of the baryon density nB and temperature T, the system of coupled differential equations Eqs. (8)–(11) was numerically solved as in Carreau et al. (2019). Specifically, we solved the coupled equations using the expressions of  and
and  of the liquid phase, yielding the optimal liquid composition Xliq = (Aliq, Iliq, n0, liq, ng, liq) and the associated free energy density ℱliq. Then, for the same composition Xliq, we calculated the free energy density assuming a solid phase ℱsol. The lowest temperature for which ℱliq ≥ ℱsol is identified as the crystallization temperature Tm corresponding to the baryon density under study.
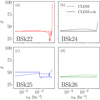 |
Fig. 1. Equilibrium value of the proton number Z as a function of baryon density in the inner crust at zero temperature for the BSk22 (panel a), BSk24 (panel b), BSk25 (panel c), and BSk26 (panel d) CLD models, with (solid lines) and without (dash-dotted lines) shell effects. See text for details. |
3. Inclusion of shell effects
In the CLD approach, shell effects, which have been known since the pioneering work of Baym et al. (1971a) to be essential for correctly evaluating the outer-crust composition in the T = 0 limit, are lost. In this same limit, the microscopic calculations of Chamel (2006) and Chamel et al. (2007) have shown that the neutron-shell effects become vanishingly small beyond the neutron-drip point, but proton shell effects persist in the inner crust. These shell corrections have been calculated using the Strutinsky integral method in Pearson et al. (2018) for the same functionals as we used here. We therefore added these corrections5 to the CLD free energy, Eq. (3). In this way, we recovered the expected appearance of the magic numbers in the composition for the inner crust, as shown in Fig. 1, where results for the composition at zero temperature for the CLD calculations (dash-dotted lines) are compared with those including Strutinsky shell corrections for the corresponding functional (solid lines). Indeed, the continuous smooth behavior of Z in the inner crust obtained in the CLD approach disappears when shell effects are added. In particular, remarkable stability at Z = 40 (Z = 40 and Z = 20) is seen for the BSk24 and BSk26 (BSk22) model, in very good agreement with Pearson et al. (2018; see their Fig. 12). A small difference only appears for the BSk25 model, reflecting the limitations of the CLD approach. For this functional, after the plateau at Z = 50, also obtained with the ETF calculations of Pearson et al. (2018) including proton shell effects with the Strutinsky integral method (ETFSI) for the same functional, Z drops to Z = 40 in our case, while increasing values of Z are observed in Pearson et al. (2018). However, Pearson et al. (2019) found a secondary minimum at Z = 40, and the free-energy per nucleon difference between the two minima is about 10−3 MeV.
To analyze the effect of the shell corrections in the free energy, we plot in Fig. 2 the free energy density as a function of Z for different densities in the inner crust and for three selected temperatures. We note that as expected, the pure CLD results are close to those including zero-temperature shell corrections only for closed-shell configurations, while remarkable differences exist for all other values of Z. This confirms the importance of properly accounting for the shell structure. The increasing discrepancy at kBT = 1 MeV, with kB the Boltzmann constant, is instead due to an overestimation of the shell corrections, which are expected to be wiped out at (high enough) finite temperature, as we discuss next.
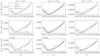 |
Fig. 2. Free energy density as a function of the proton number Z for the BSk24 CLD model for different temperatures kBT = 0 MeV (left panels), kBT = 0.1 MeV (central panels), and kBT = 1 MeV (right panels), and densities nB = 3 × 10⁻⁴ fm−3 (top panels), nB = 10−3 fm−3 (middle panels), and nB = 10−2 fm−3 (bottom panels). In each panel, dash-dotted (solid) lines correspond to the calculations including temperature-independent (temperature-dependent) shell effects, and dotted lines represent the results without shell effects. See text for details. |
A study of the temperature dependence of shell effects within the finite-temperature extended Thomas–Fermi plus Strutinsky integral approach (TETFSI) using the BSk14 functional was performed in Onsi et al. (2008), where it was shown that proton shell corrections decrease substantially around kBT = 1 MeV (see their Tables III–V). This is shown in Fig. 3, where we compare for three different temperatures the proton value Z in the inner crust as obtained in our CLD model without shell effects (solid line), with the results of Onsi et al. (2008) with (TETFSI, squares) and without (TETF, stars) shell effects.
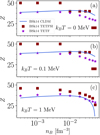 |
Fig. 3. Equilibrium value of proton number Z as a function of baryon density in the inner crust for the BSk14 functional for different temperatures: kBT = 0 MeV (panel a), kBT = 0.1 MeV (panel b), and kBT = 1 MeV (panel c). Solid lines correspond to the CLD model calculations without shell effects, and square (star) symbols correspond to the TETFSI (TETF) results from Onsi et al. (2008). See text for details. |
At relatively high temperature, our CLD results are in excellent agreement with the more microscopic TETF results of Onsi et al. (2008), for which shell corrections are also neglected. It is clearly seen that the discontinuous behavior in Z persists until kBT ≈ 1 MeV, when the TETFSI results follow the same smooth trend as the TETF and our CLD results. At low temperature and high density, higher values of Z are obtained in the CLD calculations than in the TETF ones, showing the limits of the model. A precision of about 10−4 MeV fm−3 is necessary to define the correct minimum (see Fig. 2).
In view of the observed temperature dependence of shell effects in the microscopic calculations, we introduce a temperature-dependent factor to the zero-temperature shell corrections in the free energy of our CLD model,

where
The coefficient λ can thus be determined by two parameters, T0 and x(T0), such that
We fixed T0, which represents the temperature at which shell effects vanish, and x(T0) to reproduce the TETFSI results of Onsi et al. (2008; see also Fig. 3), yielding kBT0 = 1 MeV and x(T0) = 0.02. This is of course a very rough treatment of the temperature dependence of shell effects, but we show in the next section that the difference in the results obtained with or without this temperature dependence is smaller than the uncertainty due to our imperfect knowledge of the smooth part of the nuclear functional.
4. Numerical results
For each BSk functional, the density domain ranging from the onset of neutron drip to the transition to homogeneous matter was explored. At each density, we progressively decreased the temperature from a high value such that matter is in a liquid state, until the inequality ℱliq(Tm) ≥ ℱsol(Tm) was verified. The corresponding value of Tm thus yields the crystallization temperature at that density.
The behavior of the crystallization temperature as a function of the baryon density is displayed in Fig. 4 for the model BSk25, in comparison with the estimation from Haensel et al. (2007) obtained in the limit of a pure Coulomb plasma,
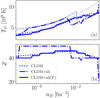 |
Fig. 4. Crystallization temperature Tm (panel a) and equilibrium value of Z at T = Tm (panel b) as a function of baryon density in the inner crust for the BSk25 CLD model. Dash-dotted (solid) lines correspond to the calculations including temperature-independent (temperature-dependent) shell effects. Results without shell effects are shown as dotted lines. Thick lines give self-consistent results for the crystallization temperature, and thin lines in the panel a correspond to the approximate expression Eq. (16). See text for details. |
In this equation, the mean ion-coupling parameter at the crystallization point is defined as Γm = (Ze)2/(kBaNTm)≈175 for a classical OCP, and aN = (4π/(3V))−1/3 with V = A(1 − ng/n0)/(nB − ng).
The qualitative behavior of the CLD calculation is very similar to the one obtained in Haensel et al. (2007) applying Eq. (16) to the ground-state composition obtained in the Douchin & Haensel (2001) CLD model. Conversely, the calculation assuming temperature-independent shell effects exhibits discontinuities similar to those obtained considering the ground-state composition of the microscopic Hartree–Fock calculation of Negele & Vautherin (1973; see Fig. 3.17 of Haensel et al. 2007). These discontinuities are however considerably smoothed out if the expected modification of the shell structure with temperature is taken into account (full line in Fig. 4). It is seen that the simple expression Eq. (16) gives a fairly good estimation of the crystallization temperature, except at the highest densities. Haensel et al. (2007) argued that setting Γm = 175 is not reliable in the densest region of the crust because the amplitude of zero-point quantum vibrations of ions becomes very large and even comparable to the lattice spacing. This effect is treated as a small correction in the derivation of the analytical formula, Eq. (16), while it is naturally included in our formalism.
The dependence on the nuclear model employed is further explored in Figs. 5 and 6, which show the transition temperature and the equilibrium value of the ion atomic number, respectively, for the three different models BSk22, BSk24, and BSk26. The same qualitative trends as in Fig. 4 can be observed. In particular, the discontinuous behavior of the crust composition obtained when the zero-temperature composition is assumed is considerably smoothed out if a temperature dependence of the shell effects is introduced, with a global result very close to the CLD prediction. However, the different nuclear models lead to predictions that progressively diverge with increasing depth, the crystallization temperature differing by up to 40% at the highest density close to the crust–core transition.
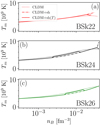 |
Fig. 5. Crystallization temperature Tm as a function of baryon density in the inner crust for the BSk22 (panel a), BSk24 (panel b), and BSk26 (panel c) CLD models. In each panel, dash-dotted (solid) lines correspond to the calculations including temperature-independent (temperature-dependent) shell effects. Results without shell effects are also shown (dotted lines). See text for details. |
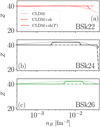 |
Fig. 6. Equilibrium value of proton number Z as a function of baryon density in the inner crust at the crystallization temperature for the BSk22 (panel a), BSk24 (panel b), and BSk26 (panel c) CLD models. In each panel, dash-dotted (solid) lines correspond to the calculations including temperature-independent (temperature-dependent) shell effects. Results without shell effects are also shown (dotted lines). See text for details. |
This model dependence arises from the lack of experimental and theoretical constraints for very neutron-rich nuclei and nuclear matter. Equation (3) shows that this concerns the bulk properties, that is, the nuclear EoS of asymmetric matter, and surface properties, that is, the surface tension of extremely neutron-rich nuclei. To progress on this issue, it is important to know the relative weight of the bulk and surface properties in determining the uncertainties in the inner-crust properties.
To this aim, we repeated the CLD calculations with the four different EoSs and fixed the surface properties following Carreau et al. (2019) by fitting only the experimentally measured masses of the spherical magic and semi-magic nuclei 40, 48Ca, 48, 58Ni, 88Sr, 90Zr, 114, 132Sn, and 208Pb. The p parameter governing the behavior of the surface tension, Eq. (6), at extreme isospin values is completely unconstrained by this fit. It was kept fixed to the constant value p = 3, which was seen to lead to a good reproduction of the core–crust transition point (see Table 1), and was also suggested in the seminal work by Ravenhall et al. (1983). The resulting models then differ in their bulk properties, but correspond to comparable surface properties consistent with experimental data, but unconstrained in the extreme neutron-rich regime.
The predictions for the crystallization temperature with the BSk22, BSk24, and BSk25 CLD models are shown in panel a of Fig. 7 (dash-dotted lines), while the associated equilibrium value of Z is reported in panel b. The width of the bands can be interpreted as an estimate of the uncertainty on the respective observables because of our incomplete knowledge of the nuclear EoS. In the same figure, solid lines represent the CLD results that we showed in Figs. 4–6, with surface parameters optimized on ETF calculations performed up to the respective driplines. A systematic difference can be observed between the two bands: systematically higher Z values are obtained when surface tension of neutron-rich nuclei is optimized on the microscopic models, and this difference obviously reflects on the crystallization temperature, which roughly scales a Z5/3 (see Eq. (16)).
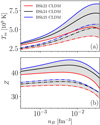 |
Fig. 7. Crystallization temperature Tm (panel a) and equilibrium value of Z (panel b) as a function of baryon density in the inner crust for BSk22, BSk24, and BSk25 CLD models with surface parameters fitted to spherical nuclei (dash-dotted lines), or to associated ETF calculations (solid lines). Gray bands represent extrema. See text for details. |
It is important to stress that the bulk parameters of the BSk functionals were precisely fit to the properties of finite nuclei and ab initio neutron-matter calculations, see Goriely et al. (2013). The residual uncertainty in the nuclear EoS is not negligible, but its consequence is less important than the uncertainties on the surface energy for neutron-rich nuclei close to neutron drip. The latter can then be considered as the key physical quantity determining the crust composition and crystallization temperature. It is also interesting to observe the anti-correlation between the symmetry energy coefficients and the crystallization temperature in the inner crust. Indeed in this regime, the higher the symmetry energy at saturation, the lower the crystallization temperature, with Esym = 32 MeV, Esym = 30 MeV, and Esym = 29 MeV for BSk22, BSk24, and BSk25, respectively.
In Fig. 8 we report the band for the CLD results with surface parameters optimized on ETF calculations, and we show the results with temperature-independent (temperature-dependent) shell corrections as dash-dotted (solid) lines. Except for BSk25 under the extreme and quite unrealistic hypothesis that shell effects are not affected by temperature, all calculations with shell effects fit in the CLD band. This indicates that simple CLD modeling could be sufficient to study crust properties at crystallization.
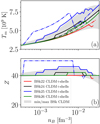 |
Fig. 8. Crystallization temperature Tm (panel a) and equilibrium value of Z (panel b) as a function of baryon density in the inner crust. The gray band corresponds to extrema for the BSk22, BSk24, and BSk25 CLD models with surface parameters fitted to associated ETF calculations. Solid (dash-dotted) lines represent the calculations for BSk22, BSk24, BSk25, and BSk26 CLD models with temperature-dependent (temperature-independent) shell corrections. See text for details. |
Finally, the variation of the proton fraction Yp (or, equivalently, of the electron fraction Ye = Yp) with temperature in the inner crust is shown in Fig. 9. Four different densities are considered. The equilibrium proton fraction at crystallization (marked by the solid symbols) tends to be lower than the prediction for fully catalyzed matter at T = 0. The effect is negligible in the densest part of the inner crust close to the crust–core transition, where the catalyzed matter hypothesis appears well justified. Conversely, a sizeable difference is observed in the proximity of the outer crust close to the drip point. In Fig. 9, the four BSk CLD models are considered, and for each density, the dispersion in their predictions is represented by the gray bands. These bands become thinner than the width of the curves for the lowest densities, meaning that the results are independent of the model.
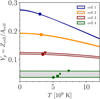 |
Fig. 9. Proton fraction Yp as a function of temperature for different values of the baryon density: nB = 3 × 10⁻⁴ fm−3 (cell 1), nB = 5 × 10⁻⁴ fm−3(cell 2), nB = 10−3 fm−3 (cell 3), and nB = 10−2 fm−3 (cell 4). Gray bands represent minima and maxima of CLD calculations for the different BSk functionals including temperature-dependent shell corrections. Circles, stars, triangles, and squares correspond to crystallization temperature for BSk22, BSk24, BSk25, and BSk26, respectively. See text for details. |
The decrease in proton fraction with temperature is easily understood from the weak interaction equilibrium condition μe = μn − μp: with increasing temperature, the electron chemical potential μe increases, leading to an increasing difference between the neutron and proton chemical potentials μn and μp, and therefore an increasing neutron-proton asymmetry. Because of the typical timescale of the weak interaction relative to the cooling dynamics, it is possible that the composition might be frozen at a temperature even higher than the crystallization temperature. In that case, the catalyzed matter hypothesis would not be justified, and the electron fraction estimated at T = 0 might lead to a significant overestimation of the effective electron fraction of the crust; this conclusion does not depend on the adopted nuclear model, and the effect is expected to be amplified in the outer crust. We expect that this finding might affect the r-process of NS mergers due to the increased Q-value for neutron capture, but a quantitative statement on this point is beyond the scope of this paper.
5. Conclusions
We have presented an extension of the recent work of Fantina et al. (2020), addressing the crystallization temperature and associated composition of the inner crust of a non-accreting neutron star. In particular, we have challenged the cold catalyzed-matter hypothesis by performing consistent calculations in the liquid and solid phases to determine the crystallization temperature of the crust in the OCP approximation and the possible modifications with respect to the ground-state composition. To settle the model dependence of the results, four different up-to-date nuclear functionals were considered. The crystallization temperature was shown to be systematically lower than the analytic expectation from Haensel et al. (2007) based on a pure Coulomb plasma. The deviation is negligible close to the neutron-drip point, but it can be as high as 30% in the deepest layers. Despite this fact, sufficiently high values are obtained in the innermost part, suggesting that substantial reduction of the shell effects should take place, and the simple CLD approximation should lead to reasonably good results. The actual importance of shell effects is affected by considerable uncertainties, and a very crude approximation was employed in this work. Still, the highest source of model dependence comes from the smooth part of the nuclear functional. In particular, fully accounting for the surface properties at extreme isospin values is seen to be essential to fix the composition of the crust at crystallization and the associated temperature. An underestimation of the crystallization temperature of about 30% at all depths in the crust is found if the surface tension is optimized on stable nuclei alone.
The largest uncertainties are associated with the deepest layers of the crust. In this region, the use of different functionals, which reproduce a large sample of different nuclear data with comparable quality, lead to a variation in the estimation of the crystallization temperature of about 40%. An additional source of uncertainty stems from the possible presence of non-spherical shapes, which we neglected here. However, the recent zero-temperature ETF studies by Martin & Urban (2015) and Pearson et al. (2020) using the same functionals as we did here report that non-spherical shapes only appear at densities of about 0.05 fm−3, very close to the transition to the core, above the density domain studied here. Moreover, the spherical geometry is seen to prevail at all densities in the TF work by Viñas et al. (2017), showing that the presence or absence of complex pasta geometries at the extreme isospin ratio of the crust depends on subtle high-order effects in the surface energy, which are beyond the purpose of our study.
Our semi-classical formalism based on the CLD model is only an approximation of the more complete TETFSI calculations that have been performed in Onsi et al. (2008). The main advantage of this formalism is that the computational time is significantly reduced in comparison with that of TETFSI calculations, in particular when the crystallization temperature is to be evaluated. This formalism can also be easily extended to account for impurities, along the same line as we have done in Fantina et al. (2020) for the outer crust. The extension to a multicomponent plasma approach and the computation of the impurity factor is in progress and will be presented in a forthcoming publication.
The mass tables are available on the BRUSLIB online database http://www.astro.ulb.ac.be/bruslib/ (Xu et al. 2013).
Updated tables containing the ETFSI energy thus the shell corrections for the BSk22, BSk24, BSk25, and BSk26 are given as supplementary material in Pearson et al. (2019).
Acknowledgments
This work has been partially supported by the IN2P3 Master Project MAC, the CNRS PICS07889, and the PHAROS European Cooperation in Science and Technology (COST) action CA16214. The work of N. C. was supported by Fonds de la Recherche Scientifique (Belgium) under Grant IISN 4.4502.19. J. M. P. thanks ULB for the award of a “Chaire internationale” for the month of November, 2019.
References
- Baym, G., Pethick, C., & Sutherland, P. 1971a, ApJ, 170, 299 [Google Scholar]
- Baym, G. A., Bethe, H. A., & Pethick, C. J. 1971b, Nucl. Phys. A, 15, 225 [NASA ADS] [CrossRef] [Google Scholar]
- Bisnovatyi-Kogan, G. S., & Chechetkin, V. M. 1979, Sov. Phys. Uspekhi, 22, 89 [Google Scholar]
- Blaschke, D., & Chamel, N. 2018, Astrophys. Space Sci. Lib., 457, 337 [NASA ADS] [CrossRef] [Google Scholar]
- Burgio, G. F., & Fantina, A. F. 2018, Astrophys. Space Sci. Lib., 457, 255 [NASA ADS] [CrossRef] [Google Scholar]
- Carreau, T., Gulminelli, F., & Margueron, J. 2019, Eur. Phys. J. A, 55, 188 [NASA ADS] [CrossRef] [EDP Sciences] [Google Scholar]
- Chamel, N. 2006, Nucl. Phys. A, 773, 263 [NASA ADS] [CrossRef] [EDP Sciences] [Google Scholar]
- Chamel, N., Naimi, S., Khan, E., & Margueron, J. 2007, Phys. Rev. C, 75, 055806 [NASA ADS] [CrossRef] [Google Scholar]
- Douchin, F., & Haensel, P. 2001, A&A, 380, 151 [NASA ADS] [CrossRef] [EDP Sciences] [Google Scholar]
- Ducoin, C., Chomaz, Ph., & Gulminelli, F. 2007, Nucl. Phys. A, 789, 403 [Google Scholar]
- Fantina, A. F., De Ridder, S., Chamel, N., & Gulminelli, F. 2020, A&A, 633, A149 [NASA ADS] [CrossRef] [EDP Sciences] [Google Scholar]
- Gnedin, O. Y., Yakovlev, D. G., & Pothekin, A. Y. 2001, MNRAS, 324, 725 [NASA ADS] [CrossRef] [Google Scholar]
- Goriely, S., Chamel, N., Janka, H.-T., & Pearson, J. M. 2011, A&A, 531, A78 [NASA ADS] [CrossRef] [EDP Sciences] [Google Scholar]
- Goriely, S., Chamel, N., & Pearson, J. M. 2013, Phys. Rev. C, 88, 024308 [NASA ADS] [CrossRef] [Google Scholar]
- Gourgouliatos, K. N., & Esposito, P. in The Physics and Astrophysics of Neutron Stars, eds. L. Rezzolla, P. Pizzochero, D. I. Jones, N. Rea, & I. Vidaña (Berlin: Springer), Astrophys. Space Sci. Lib., 457, 57 [CrossRef] [Google Scholar]
- Gulminelli, F., & Raduta, Ad. R. 2015, Phys. Rev. C, 92, 055803 [NASA ADS] [CrossRef] [Google Scholar]
- Haensel, P., Potekhin, A. Y., & Yakovlev, D. G. 2007, Neutron Stars 1. Equation of State and Structure (New York: Springer) [Google Scholar]
- Lattimer, J. M., & Swesty, F. D. 1991, Nucl. Phys. A, 535, 331 [NASA ADS] [CrossRef] [Google Scholar]
- Martin, N., & Urban, M. 2015, Phys. Rev. C, 92, 015803 [NASA ADS] [CrossRef] [Google Scholar]
- Negele, J. W., & Vautherin, D. 1973, Nucl. Phys. A, 207, 298 [NASA ADS] [CrossRef] [Google Scholar]
- Newton, W. G., Gearheart, M., & Li, B. A. 2013, ApJS, 204, 9 [NASA ADS] [CrossRef] [Google Scholar]
- Onsi, M., Dutta, A. K., Chatri, H., Goriely, S., Chamel, N., & Pearson, J. M. 2008, Phys. Rev. C, 77, 065805 [Google Scholar]
- Pearson, J. M., Chamel, N., Goriely, S., & Ducoin, C. 2012, Phys. Rev. C, 85, 065803 [NASA ADS] [CrossRef] [Google Scholar]
- Pearson, J. M., Chamel, N., Fantina, A. F., & Goriely, S. 2014, Eur. Phys. J. A, 50, 43 [NASA ADS] [CrossRef] [Google Scholar]
- Pearson, J. M., Chamel, N., Potekhin, A. Y., et al. 2018, MNRAS, 481, 2994 [NASA ADS] [Google Scholar]
- Pearson, J. M., Chamel, N., Potekhin, A. Y., et al. 2019, MNRAS, 488, 768 [NASA ADS] [CrossRef] [Google Scholar]
- Pearson, J. M., Chamel, N., & Potekhin, A. Y. 2020, Phys. Rev. C, 101, 015802 [NASA ADS] [CrossRef] [Google Scholar]
- Ravenhall, D. G., Pethick, C. H., & Lattimer, J. M. 1983, Nucl. Phys. A, 407, 571 [Google Scholar]
- Schmitt, A., & Shternin, P. in The Physics and Astrophysics of Neutron Stars, eds. L. Rezzolla, P. Pizzochero, D. I. Jones, N. Rea, & I. Vidaña (Berlin: Springer), Astrophys. Space Sci. Lib., 457, 455 [Google Scholar]
- Viñas, X., Gonzalez-Boquera, C., Sharma, B. K., & Centelles, M. 2017, Acta Phys. Pol. B Proc. Suppl., 10, 259 [NASA ADS] [CrossRef] [Google Scholar]
- Wang, M., Audi, G., Kondev, F. G., Huang, W. J., Naimi, S., & Xu, X. 2017, Chin. Phys. C, 41, 030003 [Google Scholar]
- Xu, Y., Goriely, S., Jorissen, A., Chen, G. L., & Arnould, M. 2013, A&A, 549, A106 [NASA ADS] [CrossRef] [EDP Sciences] [Google Scholar]
All Tables
Surface and curvature parameters optimized to reproduce the crust–core transition properties of functionals BSk22, BSk24, BSk25, and BSk26.
All Figures
|
Fig. 1. Equilibrium value of the proton number Z as a function of baryon density in the inner crust at zero temperature for the BSk22 (panel a), BSk24 (panel b), BSk25 (panel c), and BSk26 (panel d) CLD models, with (solid lines) and without (dash-dotted lines) shell effects. See text for details. |
| In the text | |
|
Fig. 2. Free energy density as a function of the proton number Z for the BSk24 CLD model for different temperatures kBT = 0 MeV (left panels), kBT = 0.1 MeV (central panels), and kBT = 1 MeV (right panels), and densities nB = 3 × 10⁻⁴ fm−3 (top panels), nB = 10−3 fm−3 (middle panels), and nB = 10−2 fm−3 (bottom panels). In each panel, dash-dotted (solid) lines correspond to the calculations including temperature-independent (temperature-dependent) shell effects, and dotted lines represent the results without shell effects. See text for details. |
| In the text | |
|
Fig. 3. Equilibrium value of proton number Z as a function of baryon density in the inner crust for the BSk14 functional for different temperatures: kBT = 0 MeV (panel a), kBT = 0.1 MeV (panel b), and kBT = 1 MeV (panel c). Solid lines correspond to the CLD model calculations without shell effects, and square (star) symbols correspond to the TETFSI (TETF) results from Onsi et al. (2008). See text for details. |
| In the text | |
|
Fig. 4. Crystallization temperature Tm (panel a) and equilibrium value of Z at T = Tm (panel b) as a function of baryon density in the inner crust for the BSk25 CLD model. Dash-dotted (solid) lines correspond to the calculations including temperature-independent (temperature-dependent) shell effects. Results without shell effects are shown as dotted lines. Thick lines give self-consistent results for the crystallization temperature, and thin lines in the panel a correspond to the approximate expression Eq. (16). See text for details. |
| In the text | |
|
Fig. 5. Crystallization temperature Tm as a function of baryon density in the inner crust for the BSk22 (panel a), BSk24 (panel b), and BSk26 (panel c) CLD models. In each panel, dash-dotted (solid) lines correspond to the calculations including temperature-independent (temperature-dependent) shell effects. Results without shell effects are also shown (dotted lines). See text for details. |
| In the text | |
|
Fig. 6. Equilibrium value of proton number Z as a function of baryon density in the inner crust at the crystallization temperature for the BSk22 (panel a), BSk24 (panel b), and BSk26 (panel c) CLD models. In each panel, dash-dotted (solid) lines correspond to the calculations including temperature-independent (temperature-dependent) shell effects. Results without shell effects are also shown (dotted lines). See text for details. |
| In the text | |
|
Fig. 7. Crystallization temperature Tm (panel a) and equilibrium value of Z (panel b) as a function of baryon density in the inner crust for BSk22, BSk24, and BSk25 CLD models with surface parameters fitted to spherical nuclei (dash-dotted lines), or to associated ETF calculations (solid lines). Gray bands represent extrema. See text for details. |
| In the text | |
|
Fig. 8. Crystallization temperature Tm (panel a) and equilibrium value of Z (panel b) as a function of baryon density in the inner crust. The gray band corresponds to extrema for the BSk22, BSk24, and BSk25 CLD models with surface parameters fitted to associated ETF calculations. Solid (dash-dotted) lines represent the calculations for BSk22, BSk24, BSk25, and BSk26 CLD models with temperature-dependent (temperature-independent) shell corrections. See text for details. |
| In the text | |
|
Fig. 9. Proton fraction Yp as a function of temperature for different values of the baryon density: nB = 3 × 10⁻⁴ fm−3 (cell 1), nB = 5 × 10⁻⁴ fm−3(cell 2), nB = 10−3 fm−3 (cell 3), and nB = 10−2 fm−3 (cell 4). Gray bands represent minima and maxima of CLD calculations for the different BSk functionals including temperature-dependent shell corrections. Circles, stars, triangles, and squares correspond to crystallization temperature for BSk22, BSk24, BSk25, and BSk26, respectively. See text for details. |
| In the text | |
Current usage metrics show cumulative count of Article Views (full-text article views including HTML views, PDF and ePub downloads, according to the available data) and Abstracts Views on Vision4Press platform.
Data correspond to usage on the plateform after 2015. The current usage metrics is available 48-96 hours after online publication and is updated daily on week days.
Initial download of the metrics may take a while.