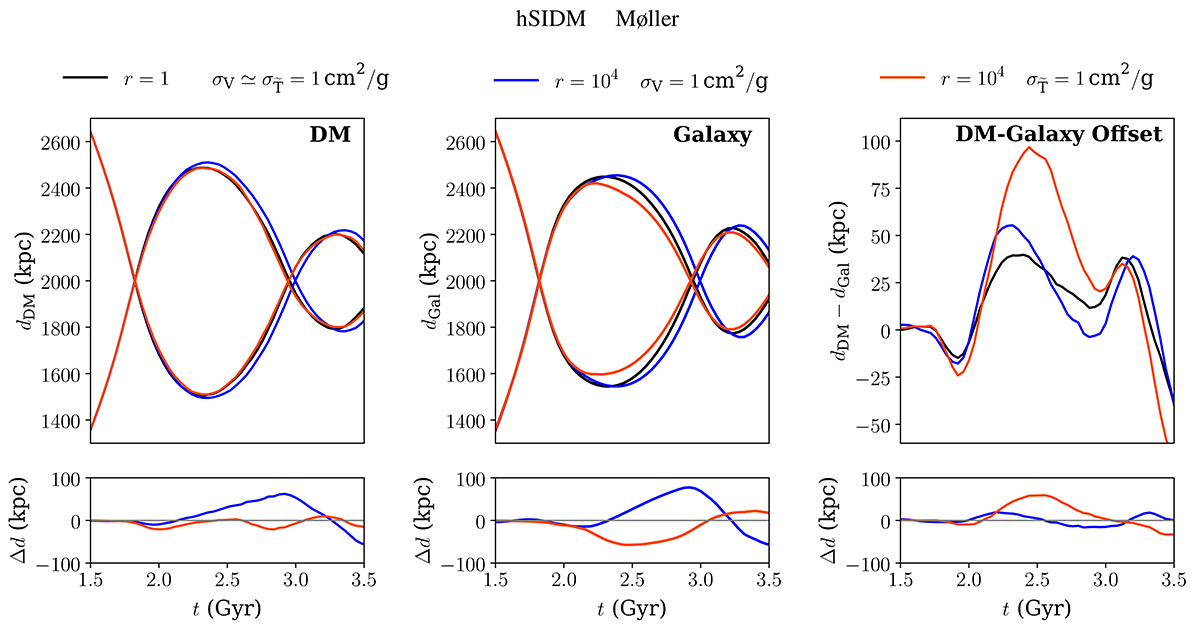
Fig. 4.
Download original image
Comparison of the evolution of DM peak positions (left column), galaxy density peak positions (middle column), and the DM-galaxy offset (right column) for three different models considered in Sect. 5.3. The result for the almost isotropic model (1) is shown in black, the result for the anisotropic model (2) with matched transfer cross section is shown in orange, and the result for the anisotropic model (3) with matched viscosity cross section is shown in blue. In the lower panels the difference (2)–(1) (orange) and (3)–(1) (blue) is shown. While the evolution of the DM peak position can be approximately matched among (1) and (2), i.e. for constant transfer cross section, this is not the case for the evolution of galaxy positions and the DM-galaxy offset. In particular, the offset is larger for anisotropic models, by a factor of ∼4 (∼2) when comparing to an isotropic model with the same transfer (viscosity) cross section. Thus, a simulation including the angle dependence is required in general to achieve reliable results.
Current usage metrics show cumulative count of Article Views (full-text article views including HTML views, PDF and ePub downloads, according to the available data) and Abstracts Views on Vision4Press platform.
Data correspond to usage on the plateform after 2015. The current usage metrics is available 48-96 hours after online publication and is updated daily on week days.
Initial download of the metrics may take a while.