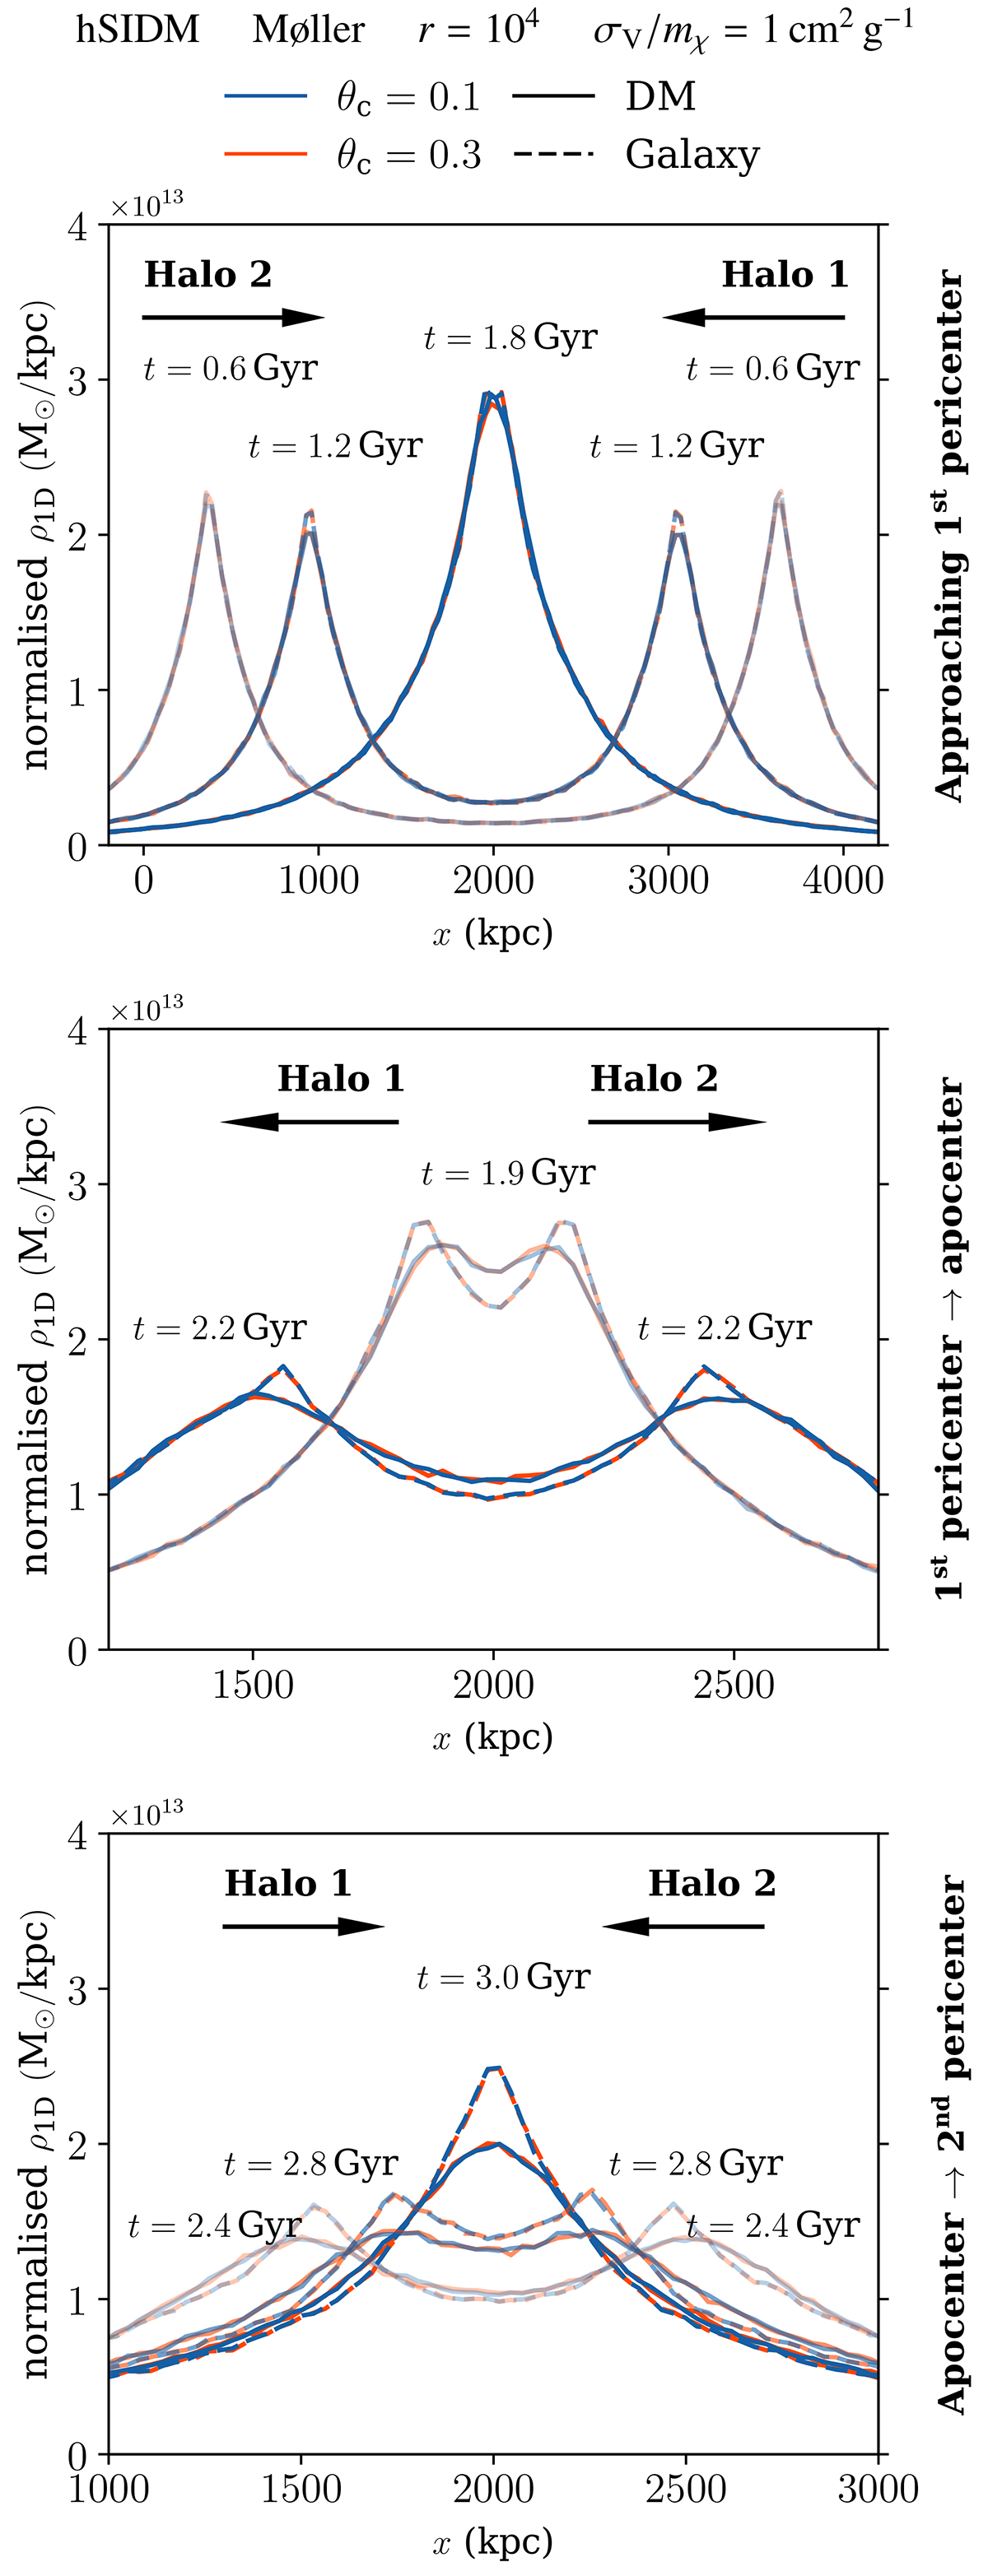
Fig. 3.
Download original image
One-dimensional density profile along the merger axis for DM (solid) and galaxies (dashed) at various times, as indicated. The top panel shows the evolution before the first pericentre passage, and the middle panel shows it shortly afterwards. In the bottom panel, the evolution following the first apocentre passage is displayed. The hSIDM scheme allows us to simulate a cluster merger for the strongly anisotropic Møller cross section with r = 104. We validate this approach by noting that the results are (practically) independent of the choice of the critical angle, for θc ∈ {0.1, 0.3} (blue and orange curves, respectively). The full time evolution movie is available online.
Current usage metrics show cumulative count of Article Views (full-text article views including HTML views, PDF and ePub downloads, according to the available data) and Abstracts Views on Vision4Press platform.
Data correspond to usage on the plateform after 2015. The current usage metrics is available 48-96 hours after online publication and is updated daily on week days.
Initial download of the metrics may take a while.