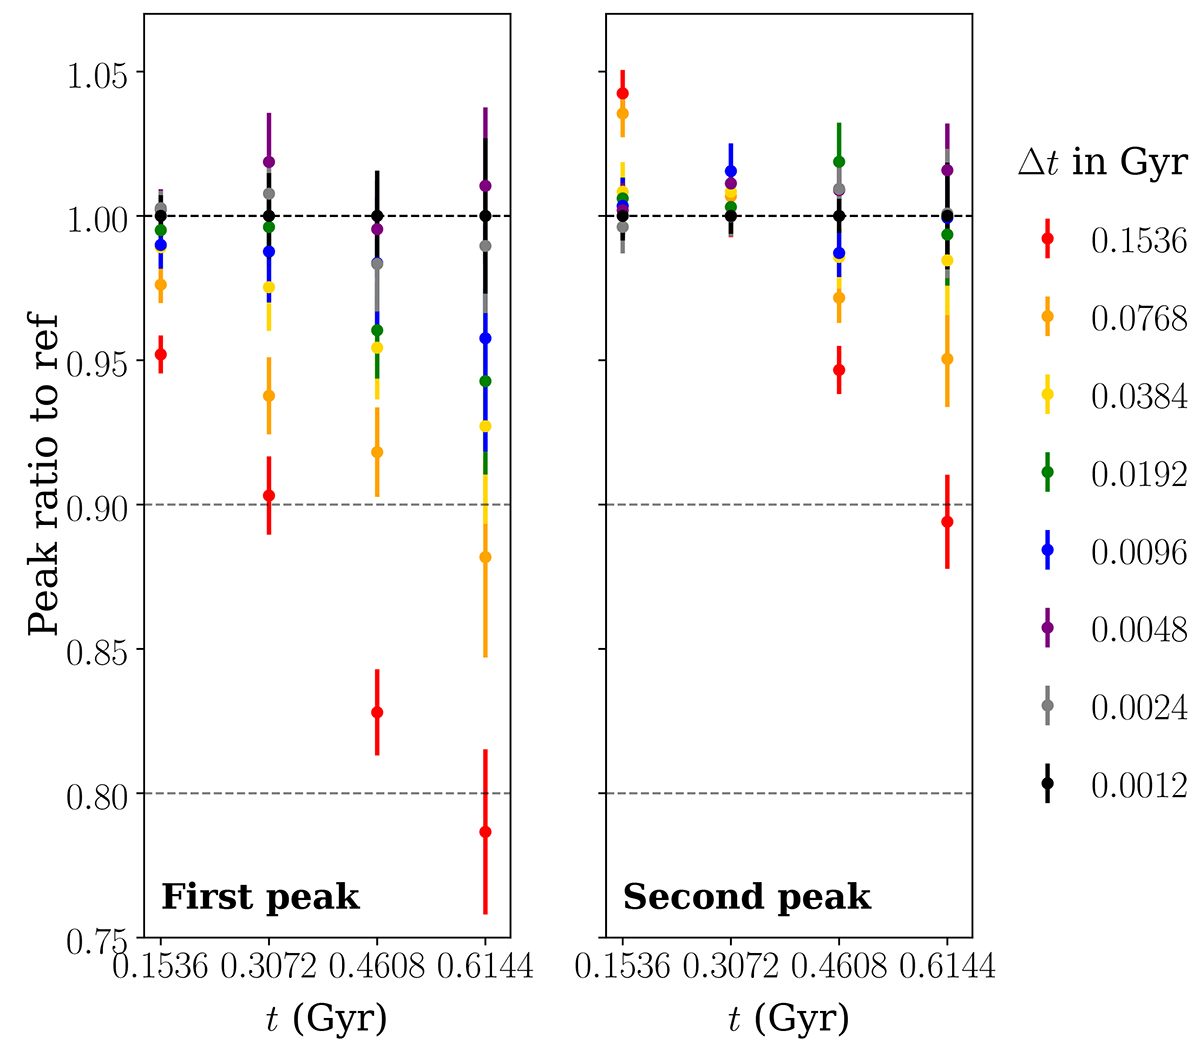
Fig. J.2.
Download original image
Fixed-angle deflection test with a varying number of time steps to the solution. The ratio of the number of particles in the first peak (i.e. particles that have not yet scattered) for the various time resolutions compared to the reference simulation is displayed as a function of time in the left panel. The results for the second peak (i.e. particles that have scattered once) are shown in the right panel.
Current usage metrics show cumulative count of Article Views (full-text article views including HTML views, PDF and ePub downloads, according to the available data) and Abstracts Views on Vision4Press platform.
Data correspond to usage on the plateform after 2015. The current usage metrics is available 48-96 hours after online publication and is updated daily on week days.
Initial download of the metrics may take a while.