Fig. I.1.
Download original image
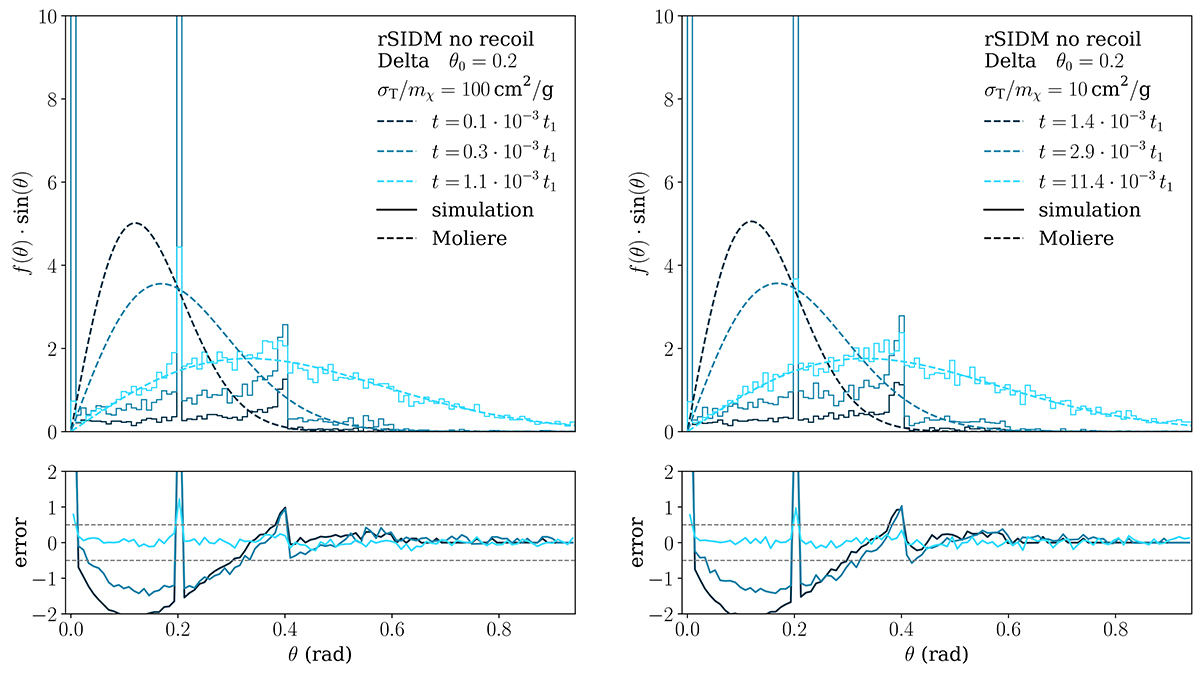
Numerical solutions of the deflection test set-up when assuming a differential cross section Eq. (4) that is peaked at a single value of the deflection angle, given by θ0 = 0.2 here. Both panels show the angular distribution function f(t, θ)⋅sin(θ) at various (early) times t, for σT/mχ = 100(10) cm2 g−1 on the left (right) side. In both cases, the simulation result agrees with the Gaussian Molière approximation Eq. (27) only after some minimal time t > tmin(θ0). This minimal time is shown in Fig. A.3 in the main text, and compared to the theoretical expectation, finding good agreement.
Current usage metrics show cumulative count of Article Views (full-text article views including HTML views, PDF and ePub downloads, according to the available data) and Abstracts Views on Vision4Press platform.
Data correspond to usage on the plateform after 2015. The current usage metrics is available 48-96 hours after online publication and is updated daily on week days.
Initial download of the metrics may take a while.