Open Access
Fig. 1
Download original image
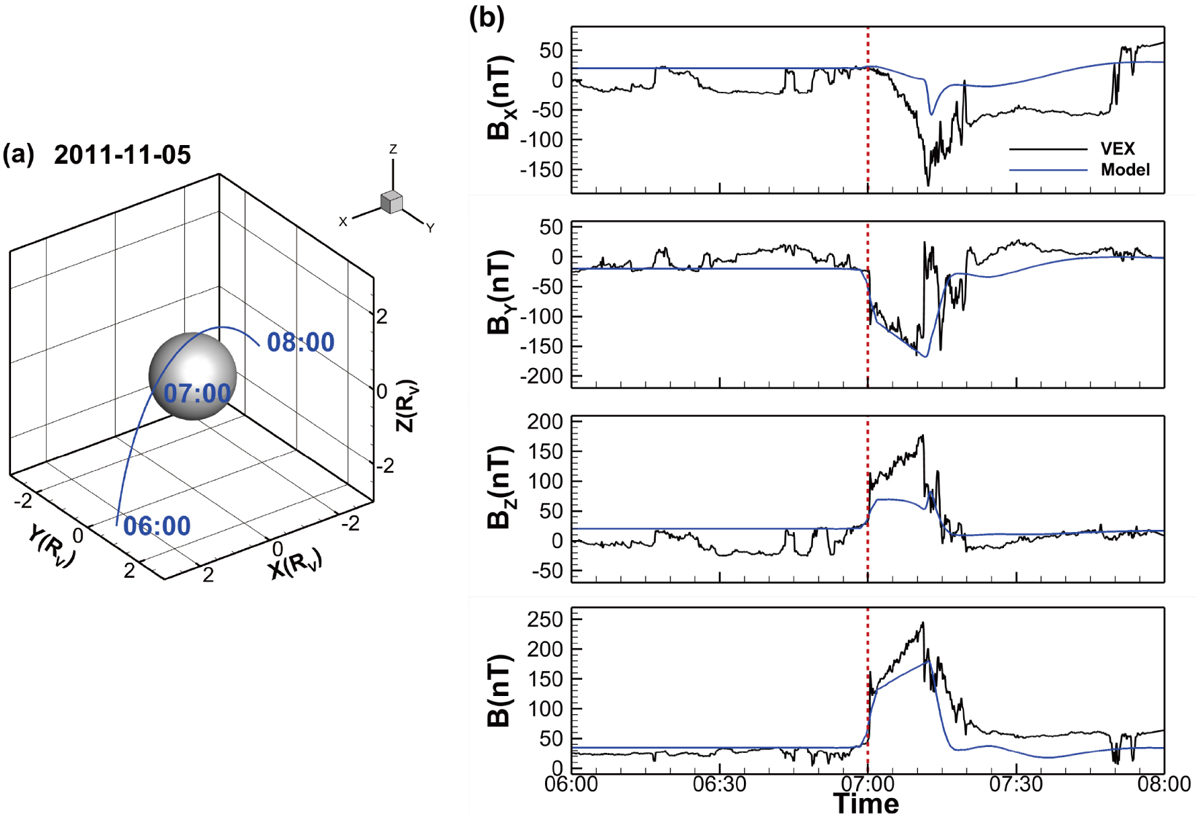
Model–data comparisons. (a) The VEX trajectory from 6:00 to 8:00 on November 5, 2011, showing the spacecraft’s position in the VSO coordinate system. (b) A comparison of simulation results (in blue) with the VEX observations (in black) along the trajectory, with the bow-shock crossing time indicated by dashed red lines.
Current usage metrics show cumulative count of Article Views (full-text article views including HTML views, PDF and ePub downloads, according to the available data) and Abstracts Views on Vision4Press platform.
Data correspond to usage on the plateform after 2015. The current usage metrics is available 48-96 hours after online publication and is updated daily on week days.
Initial download of the metrics may take a while.