Open Access
Fig. 4.
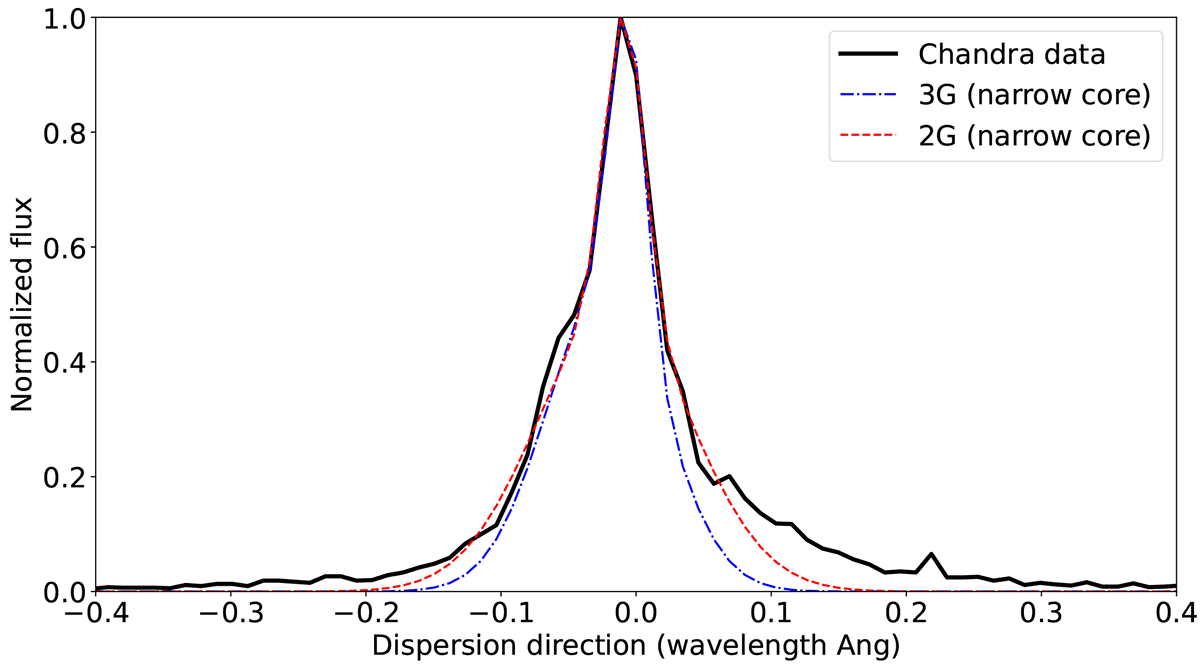
Download original image
RGS line spatial broadening computed through the Chandra surface brightness profile and Eq. (2) (black line). The lines show the narrowest Gaussian referring only to the cluster core obtained by fitting two different models with either two (dotted red line) or three (dotted blue line) Gaussian lines.
Current usage metrics show cumulative count of Article Views (full-text article views including HTML views, PDF and ePub downloads, according to the available data) and Abstracts Views on Vision4Press platform.
Data correspond to usage on the plateform after 2015. The current usage metrics is available 48-96 hours after online publication and is updated daily on week days.
Initial download of the metrics may take a while.