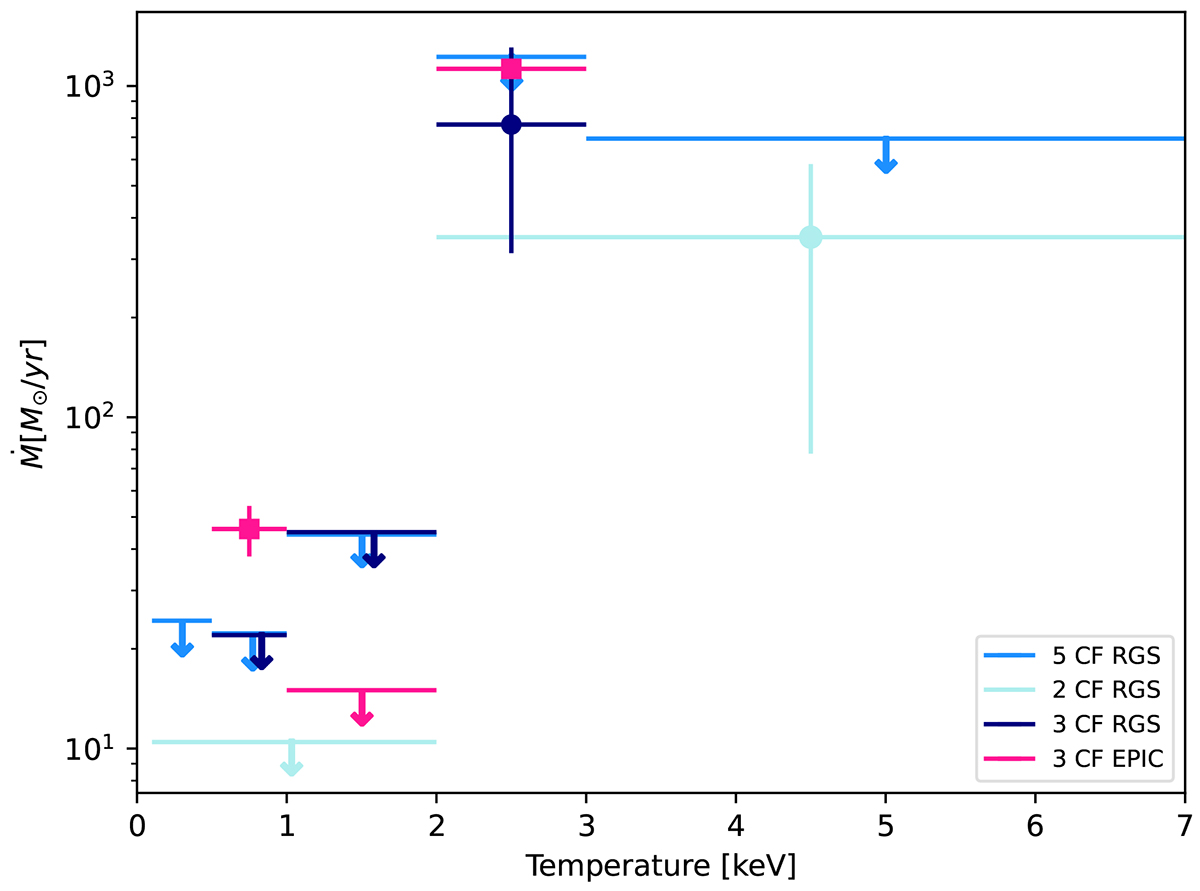
Fig. 3.
Download original image
RGS and EPIC cooling rates measurements and upper limits. In light blue, dark blue, and cyan, we show RGS values and upper limits on cooling rates obtained from a five-component, three-component and two-component CF model. In magenta, we show the EPIC measurements and upper limit of cooling rate obtained from the three-component CF model reported in Table 2 (see all stacked EPIC ObsID).
Current usage metrics show cumulative count of Article Views (full-text article views including HTML views, PDF and ePub downloads, according to the available data) and Abstracts Views on Vision4Press platform.
Data correspond to usage on the plateform after 2015. The current usage metrics is available 48-96 hours after online publication and is updated daily on week days.
Initial download of the metrics may take a while.