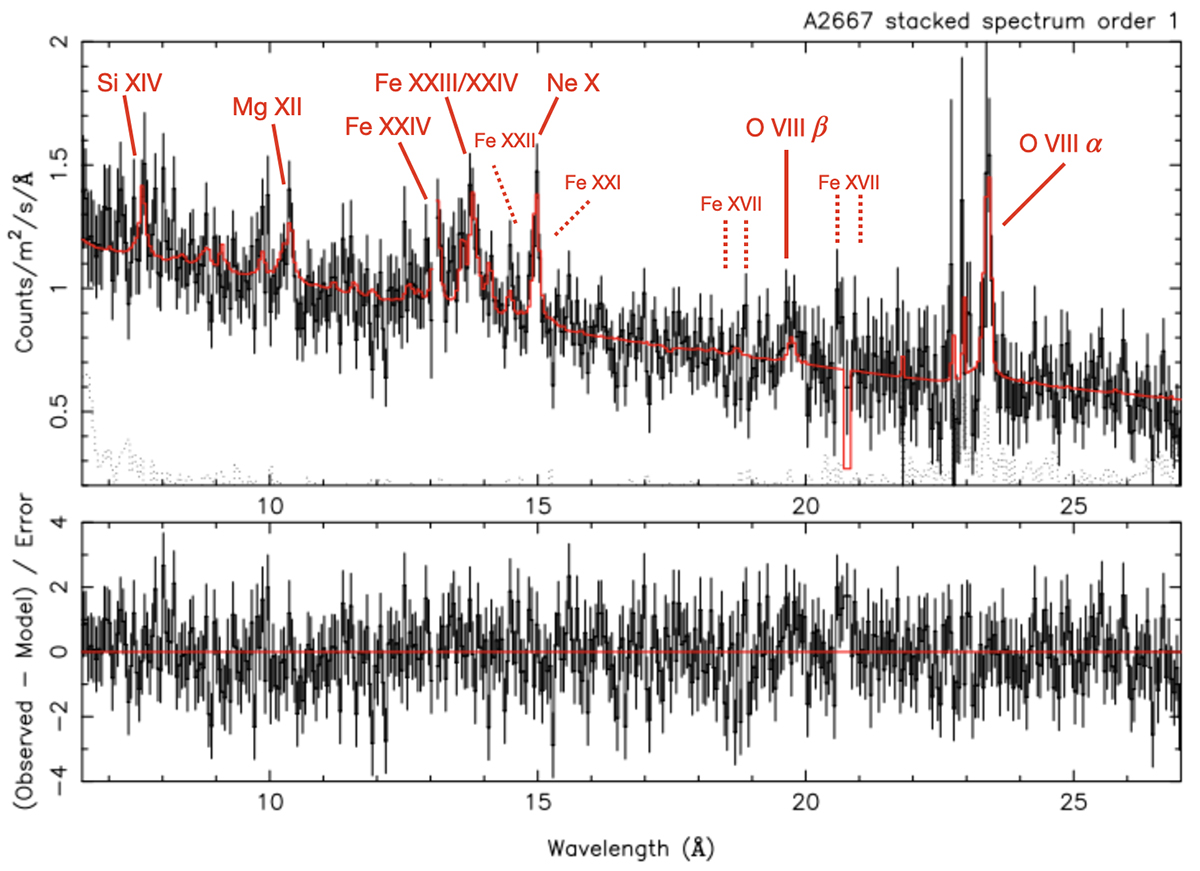
Fig. 2.
Download original image
RGS spectrum of A2667 overlaid with an isothermal model of gas in collisional equilibrium (red). Emission lines commonly detected in RGS spectra of CC clusters are labeled at the observed wavelengths. Dotted labels refer to lines from gas below 1 keV. Residuals are shown in the bottom panel. The dotted line in the upper panel represents the background spectrum.
Current usage metrics show cumulative count of Article Views (full-text article views including HTML views, PDF and ePub downloads, according to the available data) and Abstracts Views on Vision4Press platform.
Data correspond to usage on the plateform after 2015. The current usage metrics is available 48-96 hours after online publication and is updated daily on week days.
Initial download of the metrics may take a while.