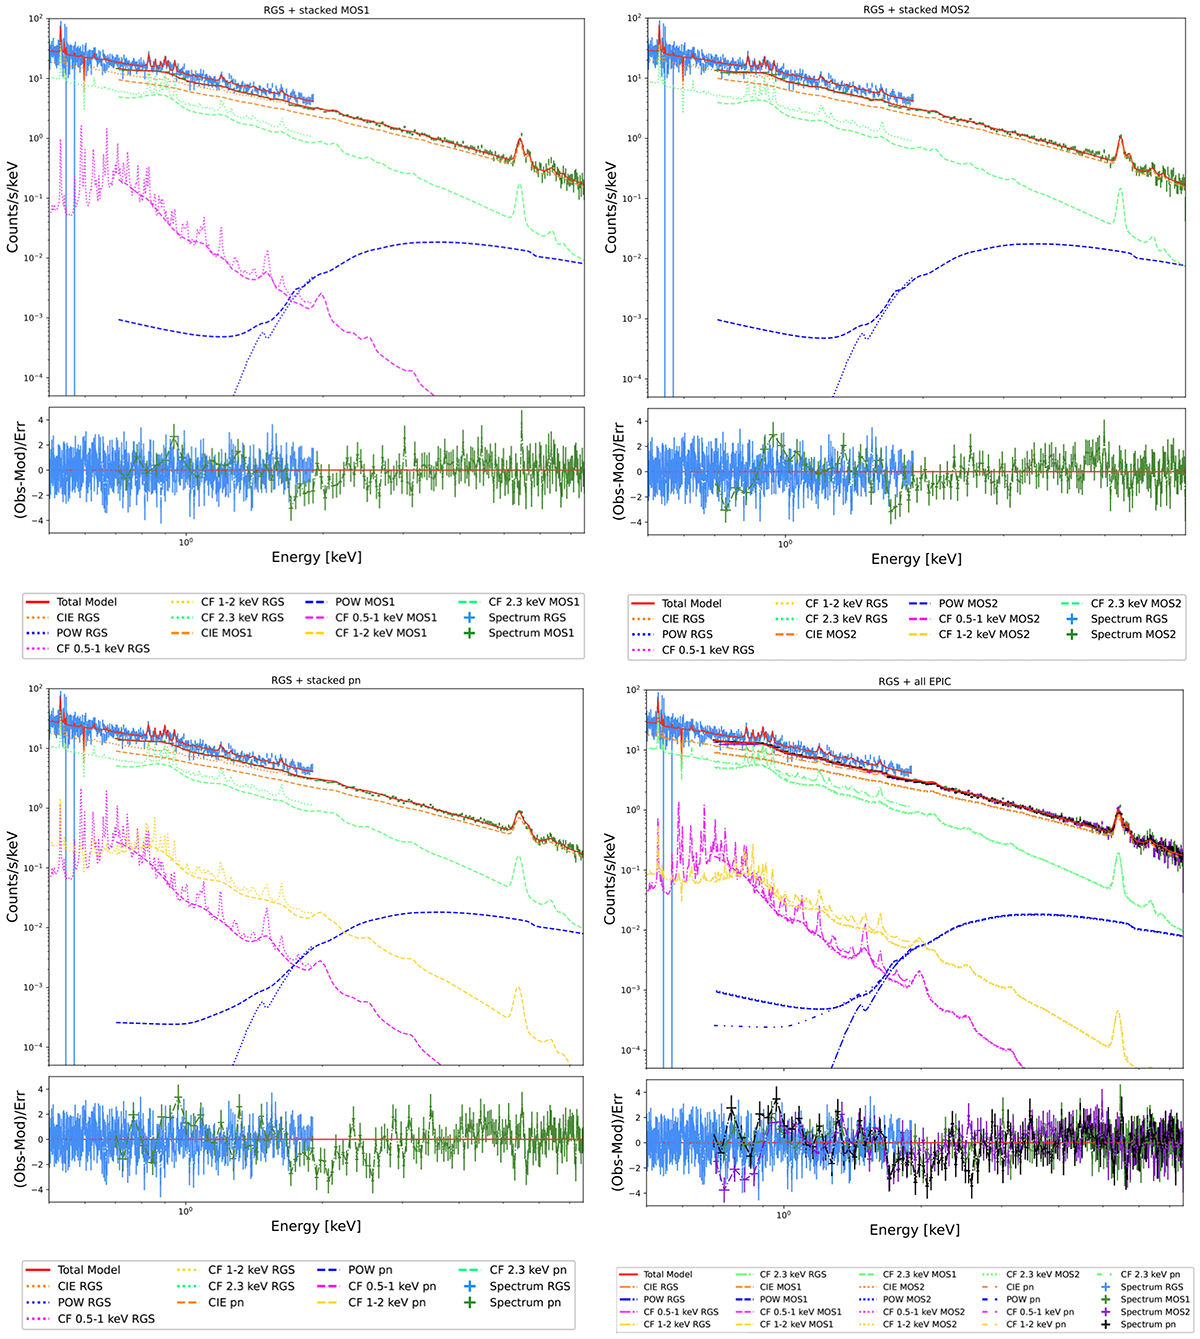
Fig. C.1.
Download original image
Spectral fit of RGS + stacked MOS1 (light blue and green points, upper left panel), RGS + stacked MOS2 (light blue and green points, upper right panel), RGS + stacked pn (light blue and green points, lower left panel), and RGS + all stacked EPIC (light blue, green, violet and black points, lower right panel). Residuals are shown in the bottom panel. The model used for fitting is the combination of cie and the isobaric CF split into three temperature intervals. The model components are represented with different colors and line styles in the plots. Orange lines represent the cie component, and blue lines represent the power law component describing the ICM and AGN, respectively. Magenta, gold, and light green lines represent the three temperature bins (0.5-1, 1-2, and 2-3 keV) components.
Current usage metrics show cumulative count of Article Views (full-text article views including HTML views, PDF and ePub downloads, according to the available data) and Abstracts Views on Vision4Press platform.
Data correspond to usage on the plateform after 2015. The current usage metrics is available 48-96 hours after online publication and is updated daily on week days.
Initial download of the metrics may take a while.