Fig. 1.
Download original image
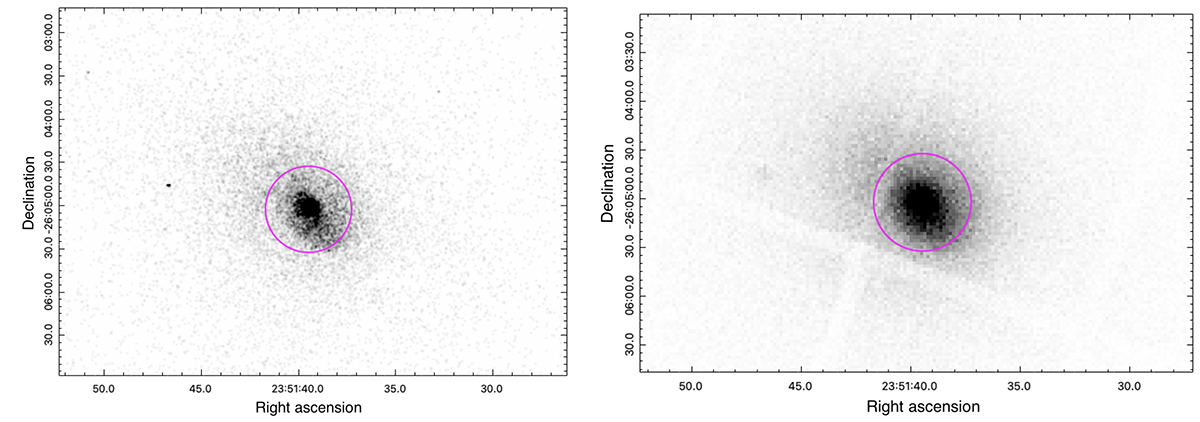
Chandra and XMM images of A2667’s central region. Left panel: Chandra [0.3−10 keV] image of A2667 in a FoV of ∼6 × 4 arcmin2. Right panel: XMM-Newton/EPIC MOS1+MOS2+pn [0.5−7 keV] image of A2667 in a FoV of ∼6 × 4 arcmin2. The magenta circle in both images shows the spectral extraction region of 0.5 arcmin radius used in XMM/EPIC data analysis.
Current usage metrics show cumulative count of Article Views (full-text article views including HTML views, PDF and ePub downloads, according to the available data) and Abstracts Views on Vision4Press platform.
Data correspond to usage on the plateform after 2015. The current usage metrics is available 48-96 hours after online publication and is updated daily on week days.
Initial download of the metrics may take a while.