Fig. 4.
Download original image
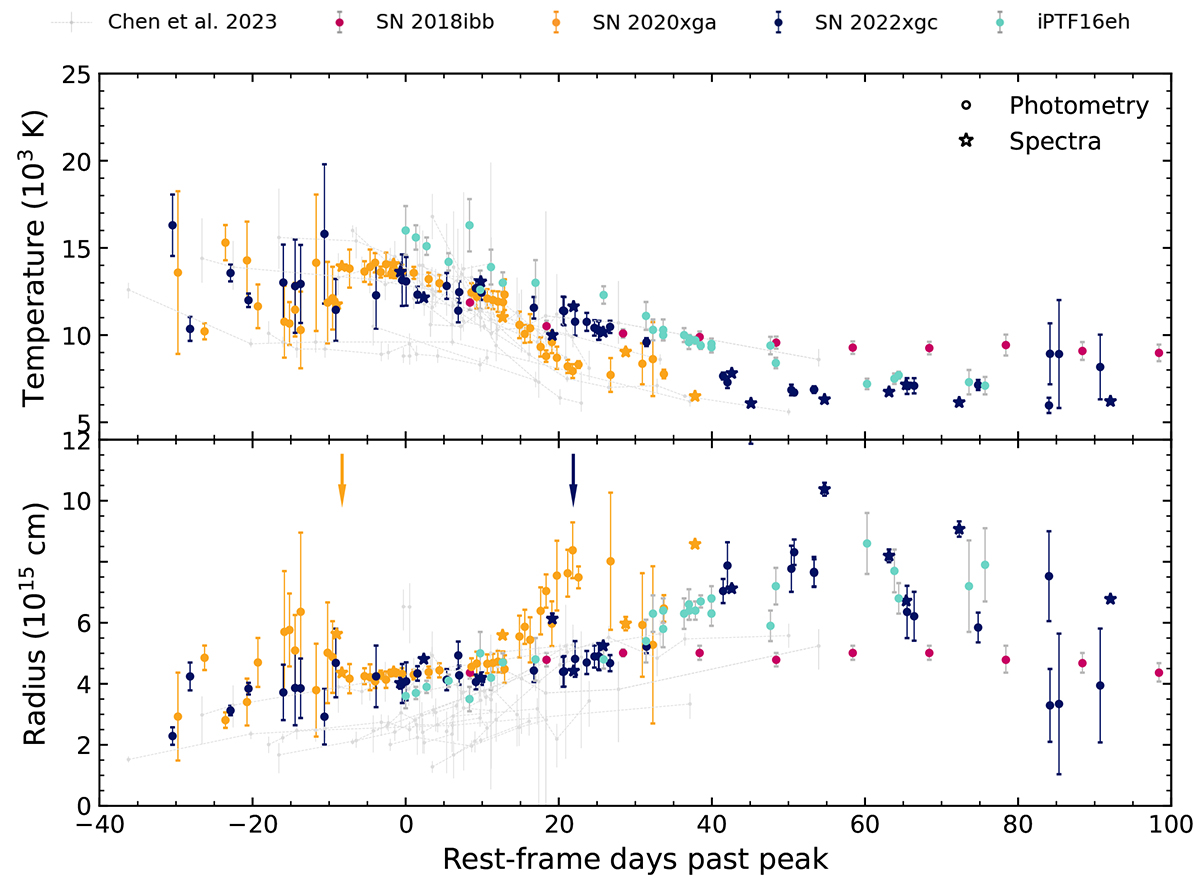
Blackbody temperatures and radii of SN 2020xga, SN 2022xgc, SN 2018ibb and iPTF16eh. Top: Temperature evolution of SN 2020xga, SN 2022xgc, SN 2018ibb and iPTF16eh derived from the blackbody fits to the photometric (circle symbols) and the spectroscopic (star symbols) data. The gray background points represent the temperature evolution of the ZTF sample (Chen et al. 2023a). Bottom: Blackbody radius evolution of SN 2020xga, SN 2022xgc, SN 2018ibb and iPTF16eh utilizing photometry and spectra in comparison with the ZTF sample (gray). The arrows indicate the epochs where the X-shooter spectra of SN 2020xga and SN 2022xgc show the second Mg II absorption system.
Current usage metrics show cumulative count of Article Views (full-text article views including HTML views, PDF and ePub downloads, according to the available data) and Abstracts Views on Vision4Press platform.
Data correspond to usage on the plateform after 2015. The current usage metrics is available 48-96 hours after online publication and is updated daily on week days.
Initial download of the metrics may take a while.