Fig. 15.
Download original image
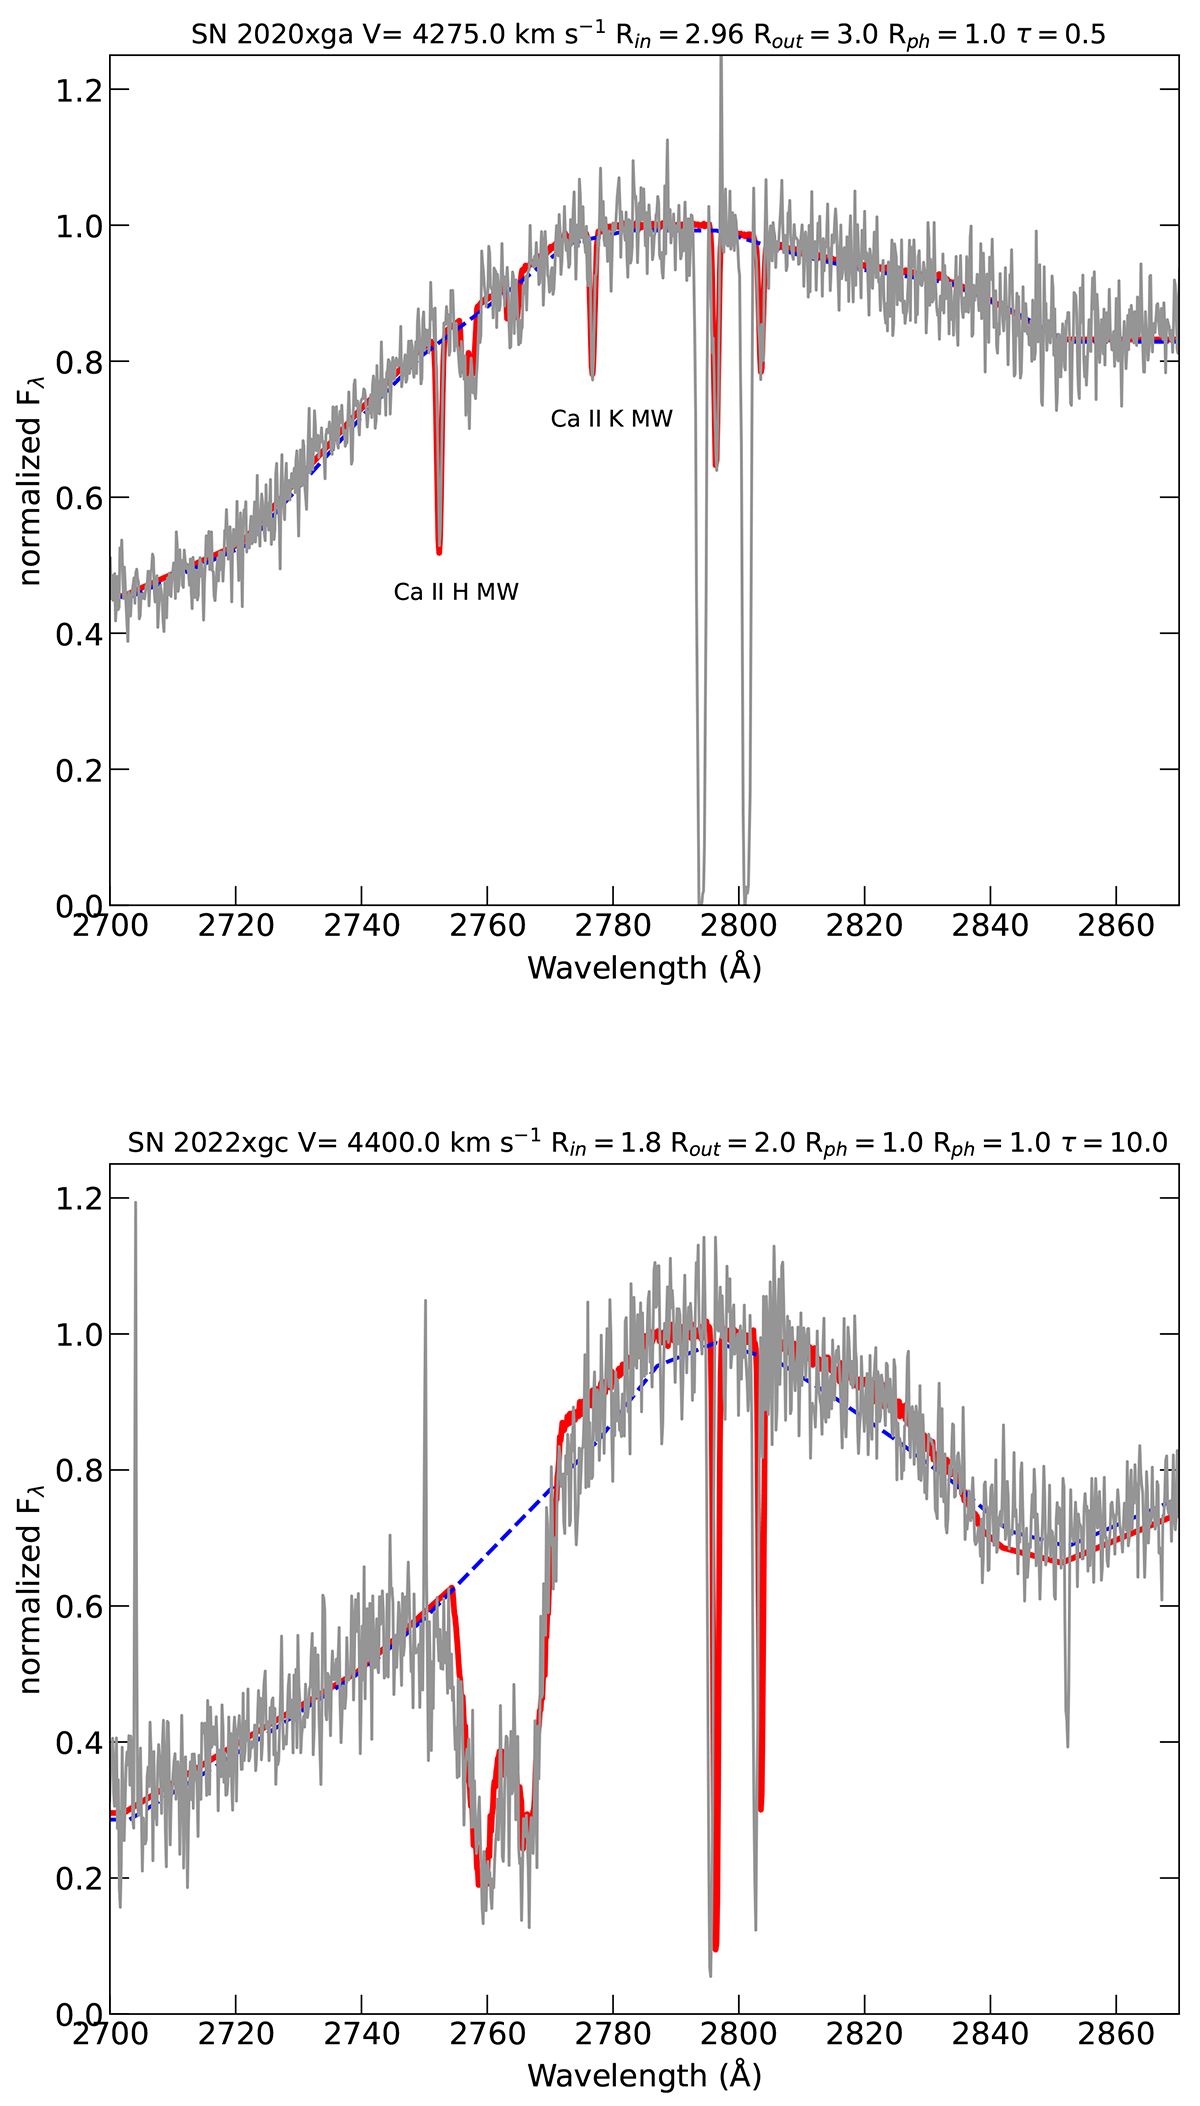
Modeling on the Mg II doublets originating from the CSM shell (broad features) and the ISM of the host galaxy (narrow features) for SN 2020xga (top) and SN 2022xgc (bottom). The observed spectrum in the 2800 Å region is presented in gray and the best model fit is shown in red. The dashed blue line illustrates the SN continuum. For SN 2020xga we have marked the CaH [MYAMP] K lines from the MW.
Current usage metrics show cumulative count of Article Views (full-text article views including HTML views, PDF and ePub downloads, according to the available data) and Abstracts Views on Vision4Press platform.
Data correspond to usage on the plateform after 2015. The current usage metrics is available 48-96 hours after online publication and is updated daily on week days.
Initial download of the metrics may take a while.