Fig. A.1.
Download original image
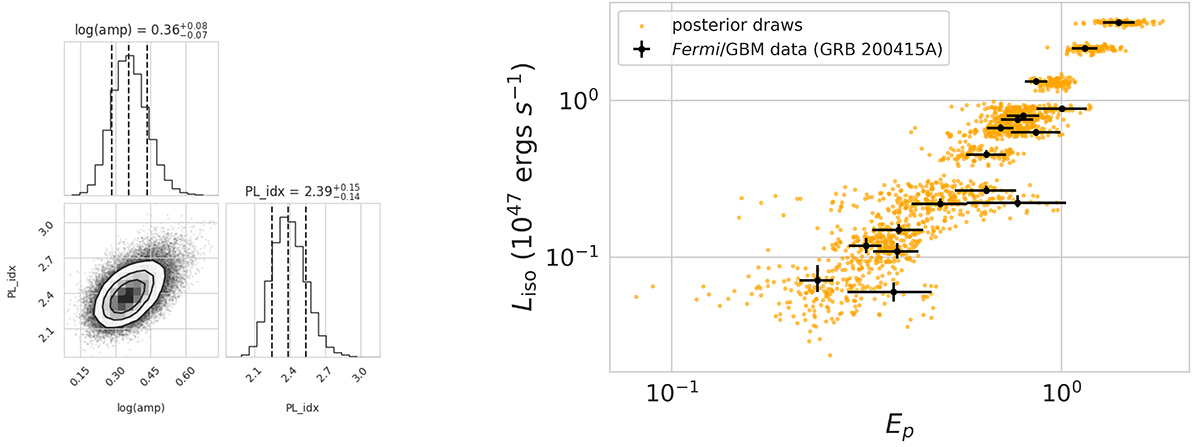
Example of fitting resultsLeft: Corner plot of posterior distributions for the two power-law parameters that describe the relationship between the peak energy and isotropic luminosity. Right: Data-resolved spectroscopy of the Fermi/GBM data for GRB 200415A (black) and the posterior predictive distribution (orange). To compute the posterior predictive distribution, we simulated the data generation process by first picking a set of parameters (![]() ) from the posterior, then generating random simulated values for Liso, sim* and Ep, sim* using the TPN distribution. This figure shows 100 such simulated datasets and enables a convenient comparison of the performance of the model with the data.
) from the posterior, then generating random simulated values for Liso, sim* and Ep, sim* using the TPN distribution. This figure shows 100 such simulated datasets and enables a convenient comparison of the performance of the model with the data.
Current usage metrics show cumulative count of Article Views (full-text article views including HTML views, PDF and ePub downloads, according to the available data) and Abstracts Views on Vision4Press platform.
Data correspond to usage on the plateform after 2015. The current usage metrics is available 48-96 hours after online publication and is updated daily on week days.
Initial download of the metrics may take a while.